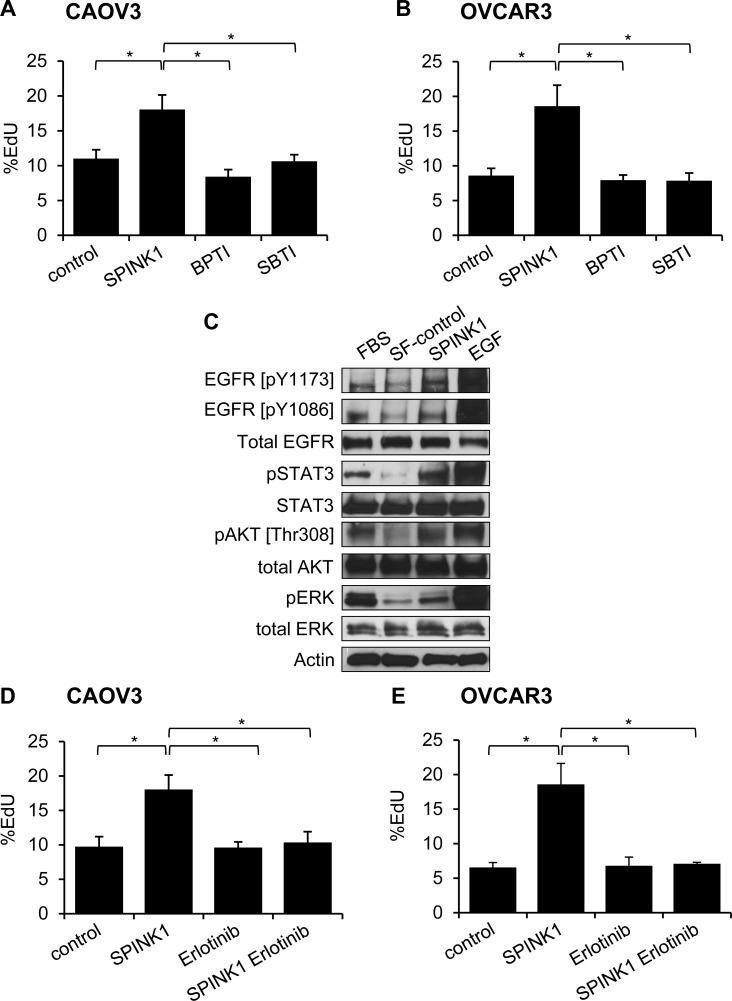
Figure 3. Molecular mechanisms of SPINK1-induced proliferation in ovarian cancer cells.
A., B. Enhanced proliferation in CAOV3 cells A. or OVCAR3 cells B. treated with 100 nM SPINK1 is not recapitulated in cells treated instead with 100 nM BPTI or 100 nM SBTI, as assessed by EdU assays. CAOV3: control (untreated cells) versus rSPINK1 p = 0.0338, control versus BPTI NS, control versus SBTI NS, SPINK1 versus BPTI p = 0.018, SPINK1 versus SBTI p = 0.0297; OVCAR3: control versus SPINK1 p = 0.039, control versus BPTI NS, control versus SBTI NS, SPINK1 versus BPTI p = 0.031, SPINK1 versus SBTI p = 0.035. C. Western blot analysis evaluating phosphorylation of EGFR, STAT3, AKT and ERK in response to rSPINK1 treatment of OVCAR3 cells under serum-free (SF) conditions. Enhanced phosphorylation is seen in rSPINK1-treated sample relative to SF control. D., E. Enhanced proliferation in CAOV3 cells D. or OVCAR3 cells E. treated with 100 nM rSPINK1 is blocked by simultaneous treatment of cells with 1 μM EGFR inhibitor erlotinib, as assessed by EdU assays. CAOV3 cells: control versus SPINK1 p = 0.021, control versus erlotinib NS, control versus SPINK1 erlotinib NS, SPINK1 versus erlotinib p = 0.021, SPINK1 versus SPINK1 erlotinib p = 0.0284; OVCAR3: control versus SPINK1 p = 0.025, control versus erlotinib NS, control versus SPINK1 erlotinib NS, SPINK1 versus erlotinib p = 0.0224, SPINK1 versus SPINK1 erlotinib p = 0.0314. *p < 0.05; **p < 0.01; ***p < 0.0001 (unpaired t-test with Welch's correction) NS not significant.

