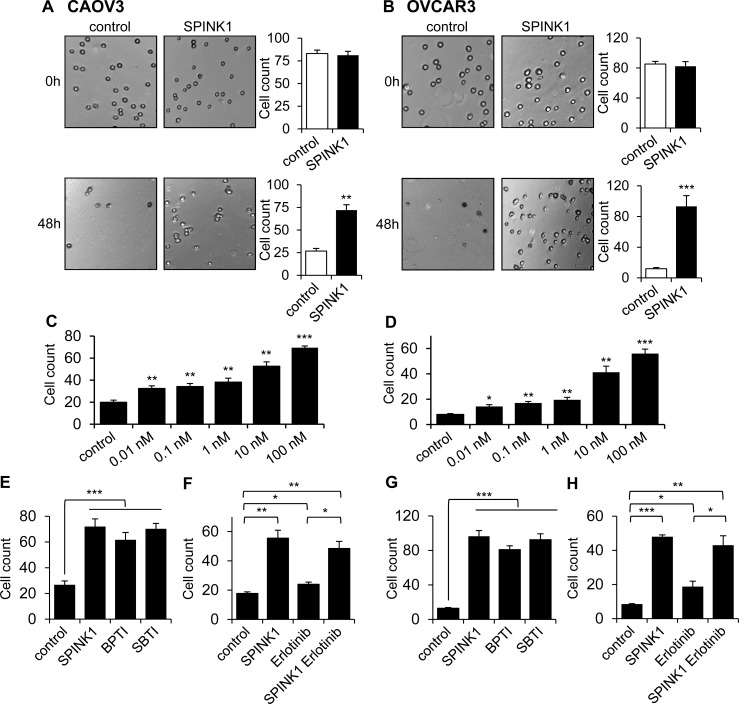
Figure 4. SPINK1 promotes resistance to anoikis in ovarian cancer cells.
A., B. CAOV3 cells A. and OVCAR3 cells B. grown under serum free conditions on ultra-low attachment plates show reduced cell count after 48 hours in the absence of rSPINK1, while higher cell density is maintained in the presence of 100 nM rSPINK1. CAOV3: p = 0.001; OVCAR3: p = 0.0009. C., D. CAOV3 cells C. and OVCAR3 cells D. show dose-dependent anoikis resistance after 48 h in response to increasing concentrations of rSPINK1. CAOV3: control vs SPINK1 0.01 nM p = 0.007, control vs 0.1 nM p = 0.0066, control vs 1 nM p = 0.0085, control vs 10 nM p = 0.0013, control vs 100 nM p < 0.0001; OVCAR3: Control vs SPINK1 0.01 nM p = 0.0171, control vs 0.1 nM p = 0.0016, control vs 1 nM p = 0.0059, control vs 10 nM p = 0.0055, control vs 100 nM p = 0.0006. E., G. CAOV3 cells E. or OVCAR3 cells G. treated with 100 nM rSPINK1 or with 100 nM of alternative trypsin inhibitors BPTI or SBTI for 48 h show a similar degree of protection from anoikis relative to untreated control cells. CAOV3: control versus SPINK1, BPTI, SBTI, p < 0.0001 (ANOVA); OVCAR3: control versus SPINK1, BPTI, SBTI p < 0.0001 (ANOVA). F., H. Protection from anoikis seen in CAOV3 cells F. or OVCAR3 cells H. treated with 100 nM rSPINK1 for 48 h is not significantly abrogated by simultaneous treatment with 1 μM EGFR inhibitor erlotinib. CAOV3: control versus SPINK1 p < 0.005, control versus erlotinib p = 0.016, control versus SPINK1 and erlotinib p = 0.0061, erlotinib versus SPINK1 plus erlotinib p = 0.0108; OVCAR3: control versus SPINK1 p < 0.0001, control versus erlotinib p = 0.0475, control versus SPINK1 and erlotinib p = 0.0082, and erlotinib versus SPINK1 plus erlotinib p = 0.0136. *p < 0.05; **p < 0.01; ***p < 0.0001 (unpaired t-test with Welch's correction unless otherwise specified).

