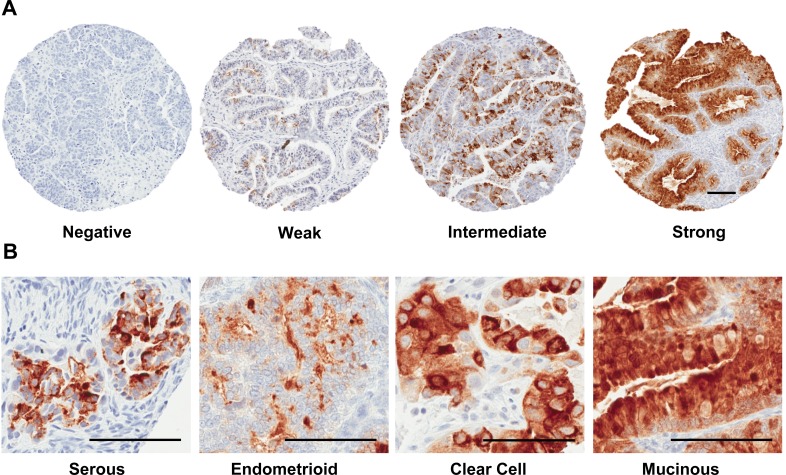
Figure 5. Tissue microarray staining for SPINK1.
A. Representative tissue cores from TMAs stained for SPINK1 were scored using an automated computer algorithm with overall scores of negative, weak, intermediate or strong assigned to reflect a composite measure of intensity and extent of staining as described in the Materials and Methods section. B. Representative fields from positive SPINK1 staining spots derived from tumors belonging to the four histological subgroups: serous, endometrioid, clear cell, and mucinous. All Scale bars 100 μm.

