
Figure 3. CTHRC1 protein and mRNA expression in EOC patients with different clinical stages.
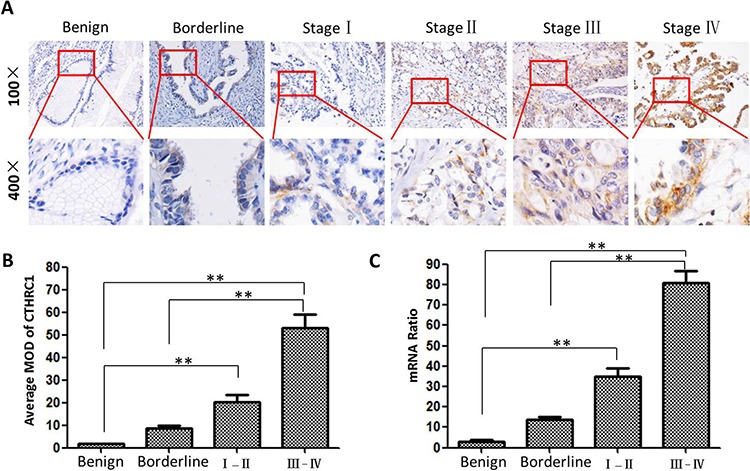
A. Representative IHC images of CTHRC1 expression in benign (n = 22), borderline (n = 17) and malignant condition (I-II: n = 28 and III-IV :n = 60), respectively. B. Statistical analyses of the average MOD for CTHRC1 staining in different disease status (** p < 0.01). C. CTHRC1 mRNA levels were analyzed by real time RT-PCR and expressed as CTHRC1/β-actin mRNA ratio (**p < 0.01).