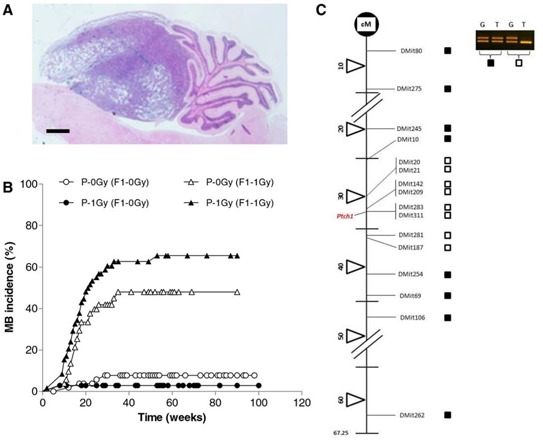
Figure 1. Medulloblastoma induction.

A. Representative histological image of medulloblastoma. Bar = 1000 μm. B. Kaplan-Meier kinetic analysis of medulloblastoma incidence obtained in unirradiated or P2-irradiated progeny of unirradiated [P-0Gy (F1–0Gy) and P-0Gy (F1–1Gy)] and irradiated fathers [P-1Gy (F1–0Gy) and P-1Gy (F1–1Gy)]. C. Representative analysis of chromosome-13 LOH in radiation-induced medulloblastomas. Solid squares indicate no LOH; open squares denote loss of signal from one allele (LOH); cM = centiMorgan.
