
Figure 2. Comet assay and immunohistochemistry results in cerebellum cells from P2 mice.
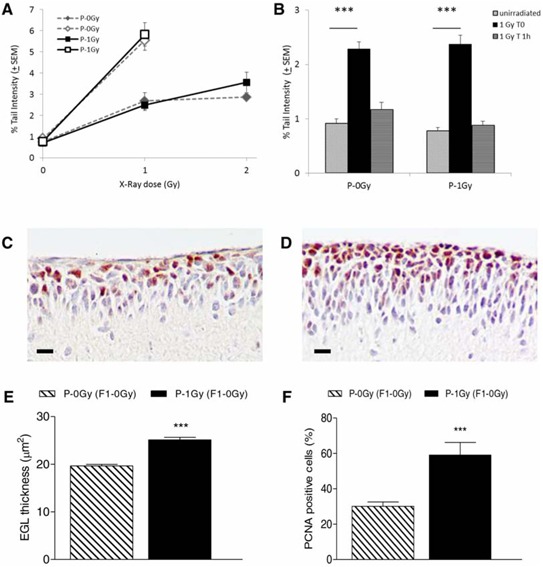
A. Dose-response curves for comet tail intensity in cerebellum cells from irradiated offsprings of irradiated (P-1Gy) or unirradiated (P-0Gy) fathers. On the same graphic, open symbols represent Tail Intensity values in cells irradiated with 1Gy x-ray on slides. Tail Intensity values were statistically increased in all irradiated groups over matched unirradiated groups (P < 0.0001). B. DNA repair in the progeny of irradiated (P-1Gy) or unirradiated (P-0Gy) fathers. Induced damage (1 Gy T0, P < 0.0001) and residual damage 1 hour after irradiation (1 Gy T 1 h) are shown. C–D. Representative image of EGL immunostained with anti-PCNA antibody from 2-weeks old unirradiated progeny of non-irradiated (C) and irradiated fathers (D) E. Rate of GCPs proliferation index, expressed as percentage of PCNA positive cells over the total number of cells counted in each mouse cerebellum, and F. relative EGL thickness (n = 6). P < 0.0001. Bars = 10 μm.