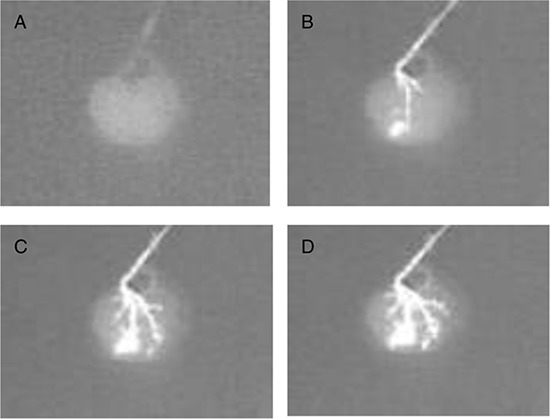
Figure 2. Fluoroangiography of a rat renal scaffold.

The fluoroangiography denotes the vascular tree is well represented through its hierarchical organization. The contrast medium was perfused at a rate of 0.5 ml/min. A–D. shows the image at times 0 s, 30 s, 60 s, 90 s.
