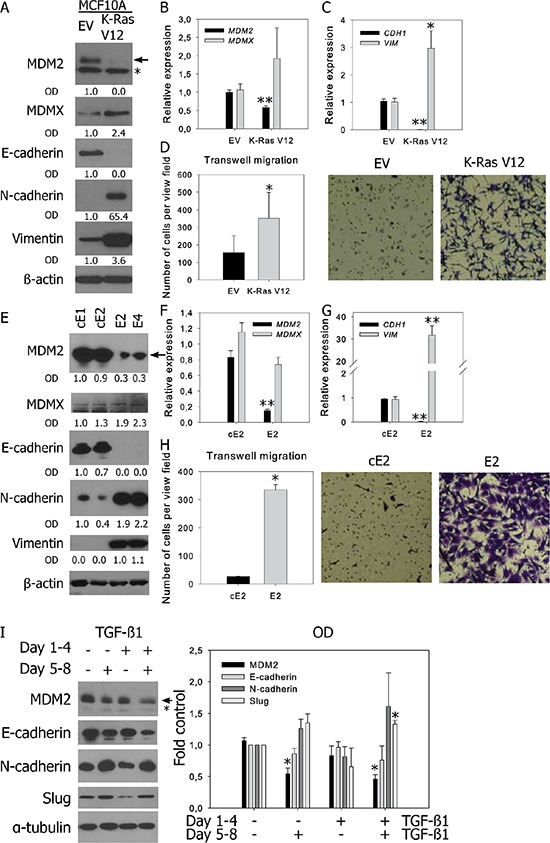
Figure 2. Decreased MDM2 expression is observed in prostate and breast cell lines with mesenchymal characteristics and in TGF-β-induced EMT.

Western blotting and qRT-PCR analysis of MDM2, MDMX, epithelial and mesenchymal markers, and cell migration in A–D. human breast MCF10A cells stably transfected with empty vector (EV) or oncogenic K-RasV12; E–H. murine prostate cancer cell lines; and I. BPH-1 cells. (A, E, I) In representative blots, the full-length MDM2 protein product is marked by an arrow, a faster-migrating product observed in human cells is marked by an asterisk; relative protein expression was evaluated by measuring OD. (B-C, F-G) PCR data represent mean ± SEM. (B–C) *P < 0.05; **P < 1.10−3 to MCF10A EV, n = 4; (F–G) **P < 1.10−3 to cE2 cells, n = 4. (D, H) Migration results through an uncoated 8 μm-pore transwell represent the average number (mean ± SD) of migrating cells in five independent viewing fields after 6 h of migration, from 3 independent experiments in technical duplicate; *P < 0.01. Photographs show results of a representative experiment at 40× magnification. (I) Both TGF-β1-induced EMT and MDM2 downregulation are reversible. Cells were treated with vehicle or TGF-β1 for 96 h, passaged and cultivated in the presence or absence of TGF-β1 for another 96 h. The graph shows the fold-over control of normalized protein expression quantified by measuring the OD, *P < 1.10−2 to untreated cells, n = 3.
