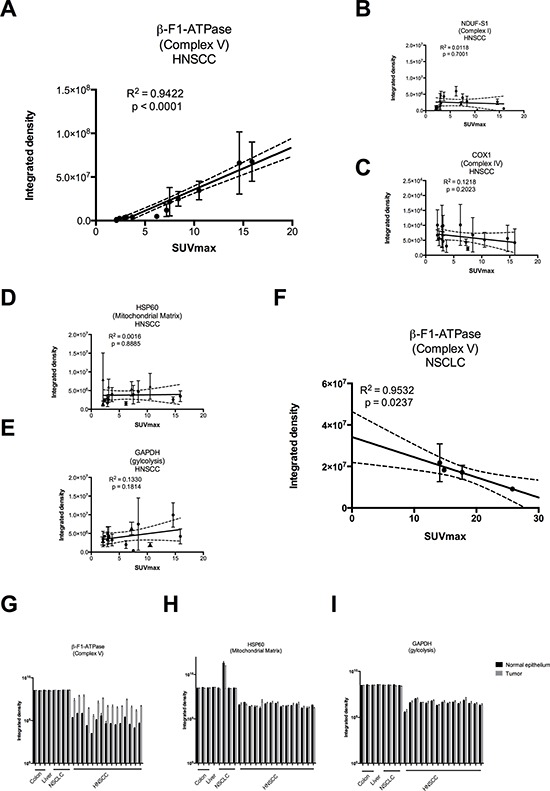
Figure 3. Regression analysis of staining intensities vs. SUVmax values A–F and raw densitometric data G–I in head and neck squamous cell carcinoma (HNSCC) vs. non-small cell lung carcinoma (NSCLC).

Staining intensities were obtained by densitometric quantification of immunoreactions as shown in Figure 2 and are expressed in arbitrary units. SUVmax = maximum standard uptake values. (G – I) black bars = normal epithelium, grey bars = tumor. Please note the logarithmic scale.
