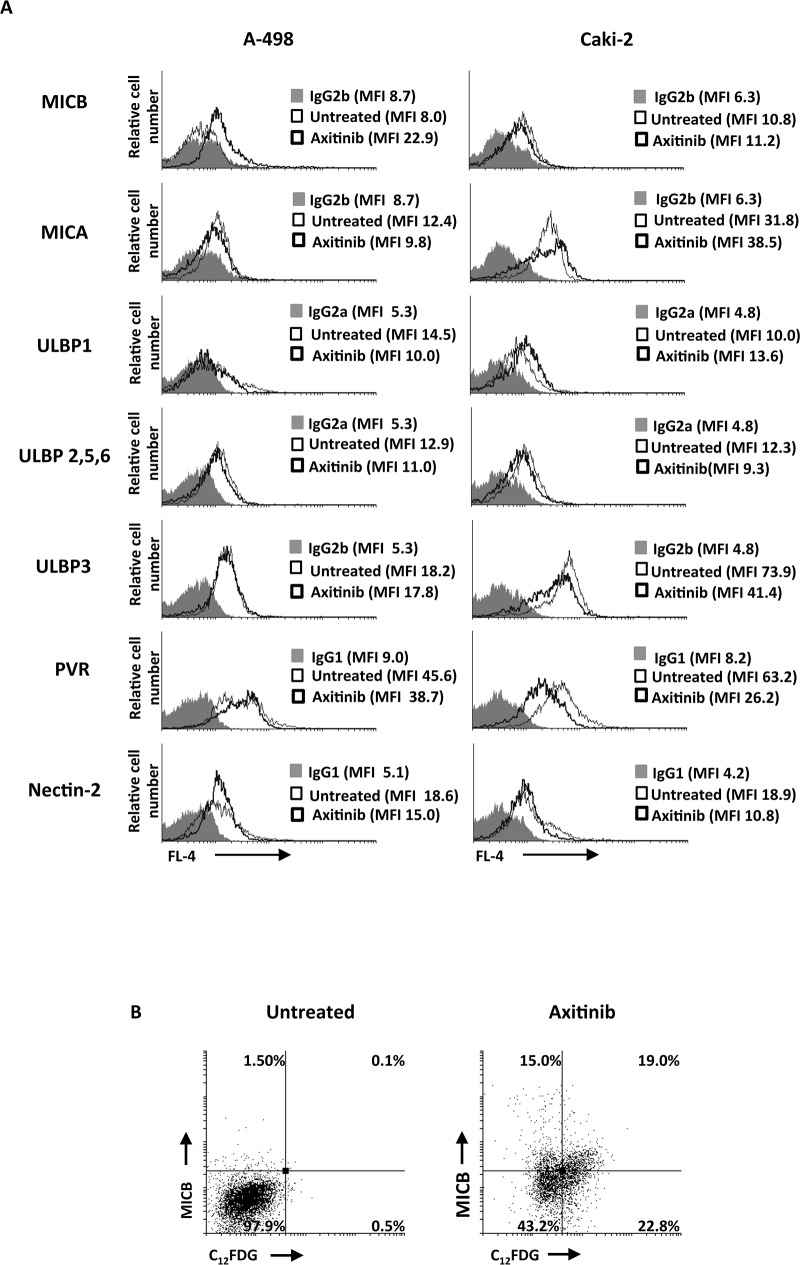
Figure 7. Modulation of NKG2D and DNAM-1 ligand expression on the RCC cell lines by axitinib treatment.
A. MICB, MICA, ULBP1, ULBP2, 5, 6 and ULBP3, PVR and nectin-2 surface expression was analyzed by flow cytometry on RCC cells treated for 72 h with axitinib or untreated. Light lines represent ligand expression in untreated cells, dark lines represent ligand expression in axitinib-treated RCC cells, whereas gray histogram isotype controls. MFI, mean fluorescence intensity. B. Representative dot plots illustrating the double fluorescence MICB-APC/C12FDG in A-498 RCC cells treated as above described. Numbers represent the percentage of cells in each quadrant. Results are representative of 1 of 3 independent experiments.

