
Figure 1. GIT1 overexpression correlates with poor prognosis in NSCLC tumors.
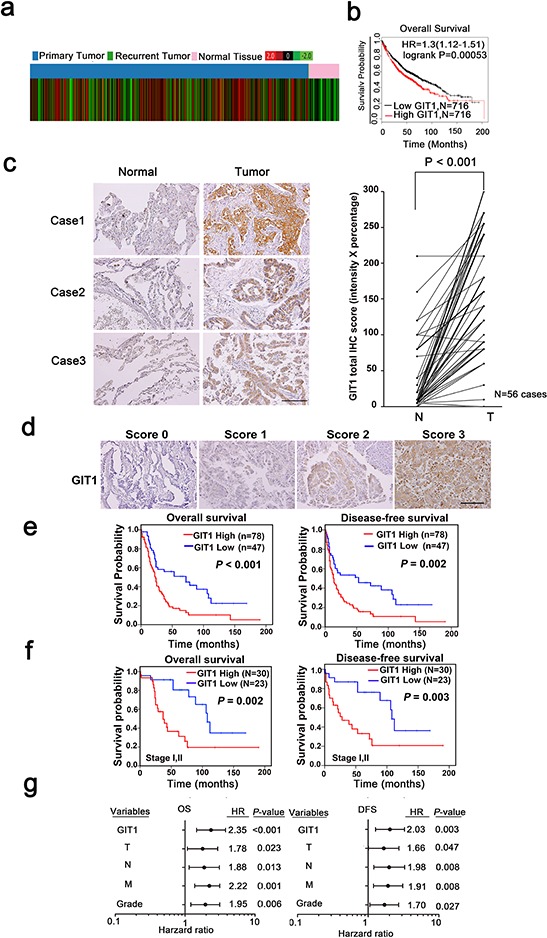
a. Public database analysis of the clinical significance of GIT1 mRNA expression in lung cancer using TCGA contains 1124 cases. Red color in the heat map indicates high GIT1 expression and green color indicates low GIT1 expression. b. In Kaplan-Meier plotter microarray database, overall survival plot shows that patients with high GIT1 expression had poor prognosis. Individual database number and P value of each plot are indicated. c. Representative images from IHC staining of GIT1 protein levels in matched primary lung tumors and normal adjacent tissues. Scale bars, 100 μm. Quantification of cytoplasmic IHC expression of GIT1 in primary lung tumors in comparison with paired normal tissues. The scores are calculated as staining intensity multiplied by percentage of stained cells. d. Scores indicating GIT1 levels in representative lung tumor tissues. Scale bars, 100 μm. e, f. Kaplan–Meier plots of overall survival and disease-free survival of 125 patients and early stage (stage I and II) of 53 patients with non-small cell lung cancer stratified by GIT1 level. The differences between groups were tested using log rank tests. g. Multivariate regression analysis of TNM prognostic factors and GIT1 expression.