
Figure 2. GIT1 promotes migration and invasion of NSCLC cells.
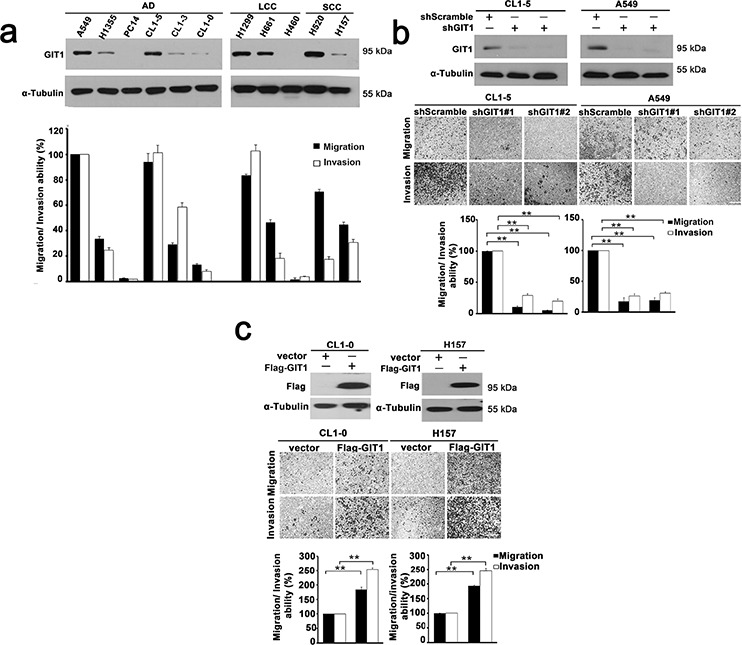
a. GIT1 expression among non-small cell lung cancer cell lines was analyzed by western blotting (Top). Quantitative data of migration and invasion of NSCLC cell lines is shown by histogram and the fold differences are compared with A549 (Bottom). AD, adenocarcinoma; LCC, large cell carcinoma; SCC, squamous carcinoma. b. Knockdown of GIT1 by two different GIT1-specific shRNAs in cell lines with high GIT1 expression, CL1–5 and A549. Western blot analysis shows two different shRNAs against GIT1 in CL1–5 and A549 with shScramble is used as a control. Quantitative data of migration and invasion in GIT1-knockdown CL1–5 and A549 is shown by histogram and the fold differences are compared with control cells. c. Overexpression of GIT1 in cell lines with low GIT1 expression, CL1–0 and H157. Western blot analysis shows expression levels of GIT1 in CL1–0 and H157, Vector, was used as a control. Quantitative data of migration and invasion of GIT1-overexpression CL1–0 and H157 are shown by histogram and the fold differences are compared with control cells. *P < 0.05. **P < 0.01.