
Figure 4. GIT1 regulates the activation status of Cdc42/Rac1.
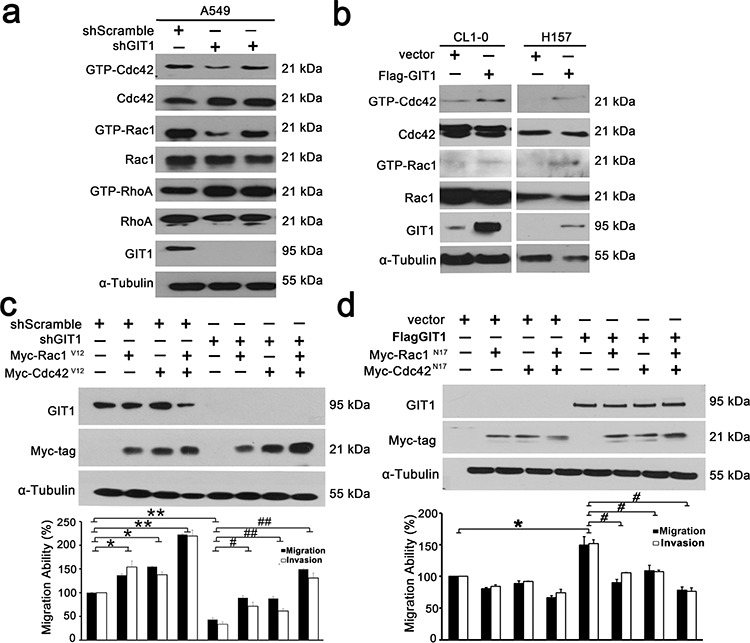
a. Representative blots of Rac1/Cdc42/RhoA assays. A549 cells were infected with lentivirus of shRNAs against GIT1 and with the corresponding controls as indicated. b. H157 and CL1–0 cells were transfected with Flag-GIT1 and with the corresponding controls. GTP-Cdc42 and Rac1 were assayed using GST-PBD. GTP-RhoA was assayed using GST-TBD. Each experiment was repeated three times and the amounts of GTP-Cdc42/Rac1/RhoA were analyzed by densitometer. c. Analysis of cell migration of CL1–5 cells transiently transfected with either GIT1 shRNA or control vector, or together with Myc-tagged Cdc42V12 or Rac1V12. Quantitative data of migration and invasion of CL1–5 cells for each group are shown by histogram and the fold differences are compared with control cells (left panel). *P < 0.05. **P < 0.01, #P < 0.05. ##P < 0.01. d. Analysis of cell migration of H157 cells transiently transfected with either Flag-GIT1 or control vector, or together with Myc-tagged Cdc42N17 or Rac1N17. Quantitative data of migration and invasion of H157 cells for each group are shown by histogram and the fold differences are compared with control cells (left panel). *P < 0.05, #P < 0.05.