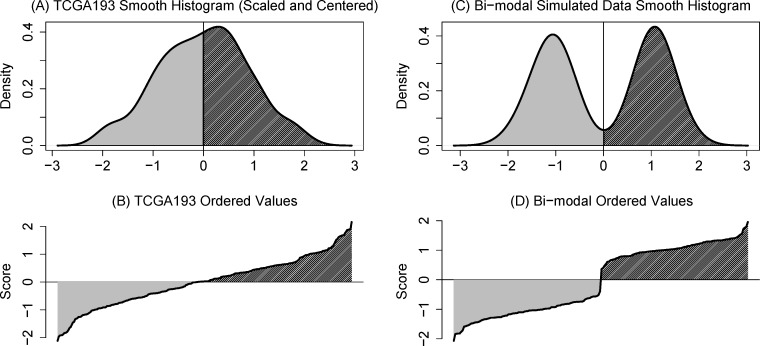
Figure 3.
A. Discrepancy between Cox model and median split is greatest around the sample mode. B. Smoothed density of TCGA193 signature shows a strong mode. C. The trace, a plot of ordered values, seems to suggest a cut point. D. Smoothed histogram of simulated bimodal data (ideal for a cutpoint). E. Corresponding trace plot shows a “cliff” and not a smooth slope.

