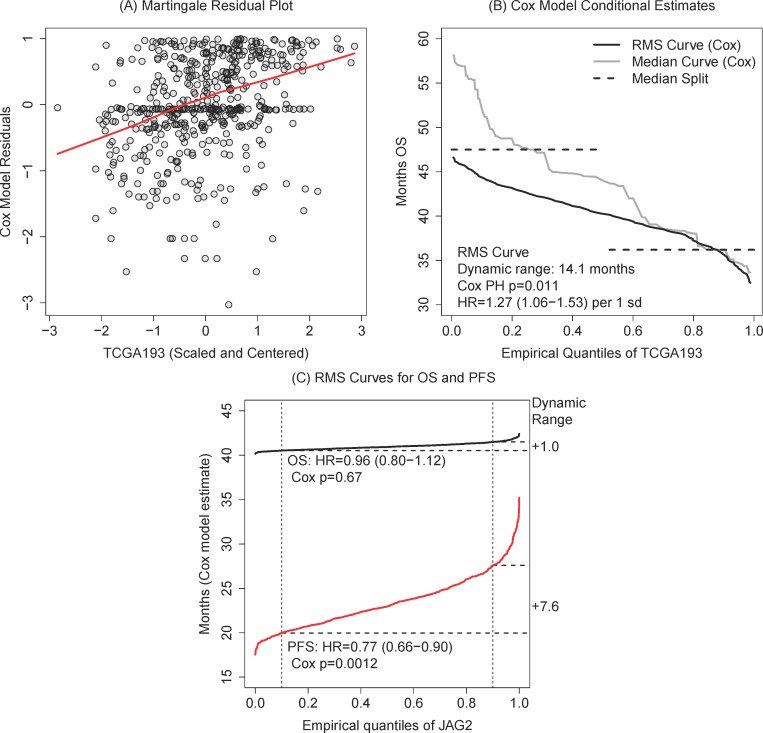
Figure 4.
A. Diagnostic martingale residual plot with a lowess smoother supports a linear effect for TCGA193. B. RMS curve plot expresses the clinical time range covered by Cox model estimate in comparison to the conditional median and median-split estimates. C. Over quantiles of JAG2, we plot significant RMS curves for PFS but not OS. This demonstrates a potential way to identify informative genes for ovarian cancer: genes associated exclusively with PFS may be more likely to be treatment-related.

