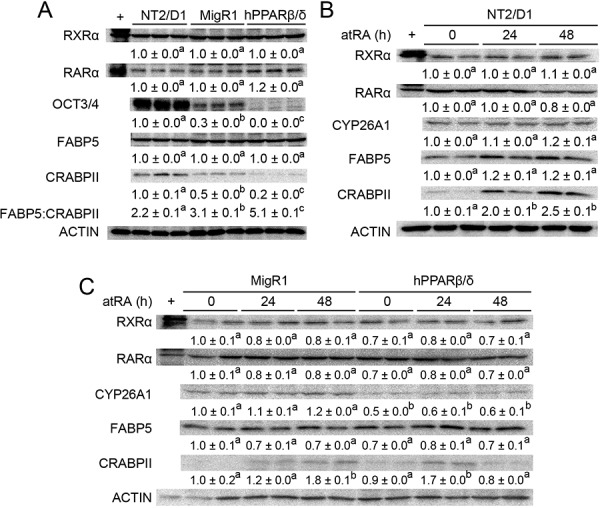
Figure 10. PPARβ/δ interferes with atRA-stimulated signaling in NT2/D1 cells.

A. Quantitative western blot analysis of RXRα, RARα, OCT3/4, FABP5 and CRABPII expression in NT2/D1, NT2/D1-MigR1 (MigR1) and NT2/D1-hPPARβ/δ (hPPARβ/δ) cells. B, C. Quantitative western blot analysis of RXRα, RARα, CYP26A1, FABP5 and CRABPII expression in NT2/D1, MigR1 and hPPARβ/δ cells in response to atRA treatment. Values represent mean ± S.E.M. Values with different superscript letters are significantly different at p ≤ 0.05.
