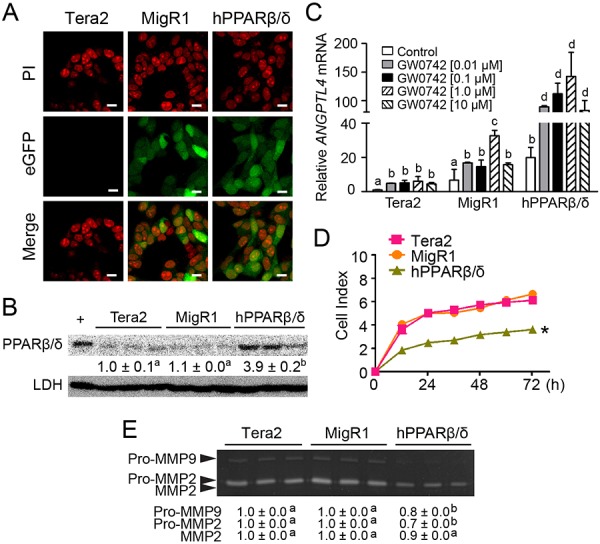
Figure 2. Characterization of human testicular embryonal carcinoma cell line Tera2 over-expressing PPARβ/δ.

A. Representative photomicrographs of Tera2, MigR1 and hPPARβ/δ cells showing positive eGFP signals in MigR1 and hPPARβ/δ cells. PI staining indicates cell nuclei. Magnification = 600X. Bar = 10 μm. B. Quantitative western blot analysis of PPARβ/δ expression in Tera2, MigR1 and hPPARβ/δ cells. +, positive control (cell lysate from COS1 cells transfected with human PPARβ/δ expression vector). Relative PPARβ/δ expression was normalized to LDH. C. Cells were treated with the PPARβ/δ agonist GW0742 for 24 hours. ANGPTL4 mRNA expression was determined by qPCR and compared to the parent cell line. D. Real-time proliferation was examined in Tera2, MigR1 and hPPARβ/δ cells. E. Activities of MMP2 and MMP9 in Tera2, MigR1 and hPPARβ/δ cells were determined by zymography. Values represent mean ± S.E.M. Values with different superscript letters are significantly different at p ≤ 0.05. *Significantly different than control, p ≤ 0.05.
