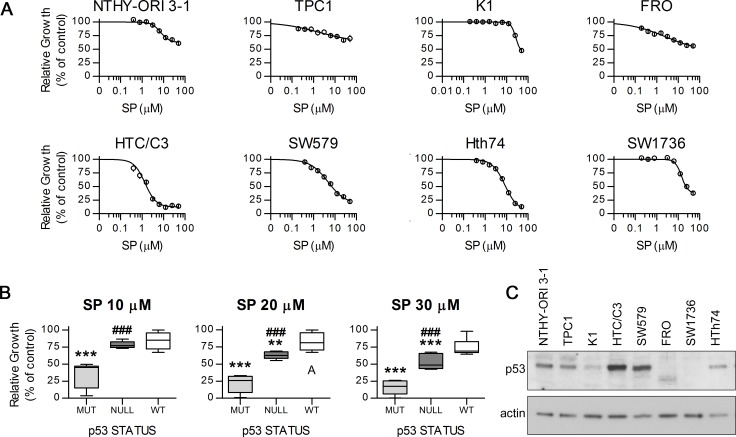
Figure 1. Antiproliferative effect of SP on distinct thyroid cancer cell lines with different TP53 status.
Cell lines were exposed to different concentrations of SP or equal amount of DMSO for 96 hours and growth inhibition was assessed with MTT assay. A. Growth curves of the cell lines showing different degrees of inhibition. B. SP effects on the cell lines grouped by p53 status. C. Western blot confirming the differential expression of p53 in our cell lines; actin was used as loading control. MUT, p53 missense mutant, HTC/C3, Hth74 and SW579 cells; NULL, p53 pseudo-null, SW1736 and FRO cells; WT, p53 wild type, NTHY-ORI 3-1, TPC1 and K1 cells. ***p < 0.001, **p < 0.01 vs. WT, ###p < 0.001 vs. MUT.

