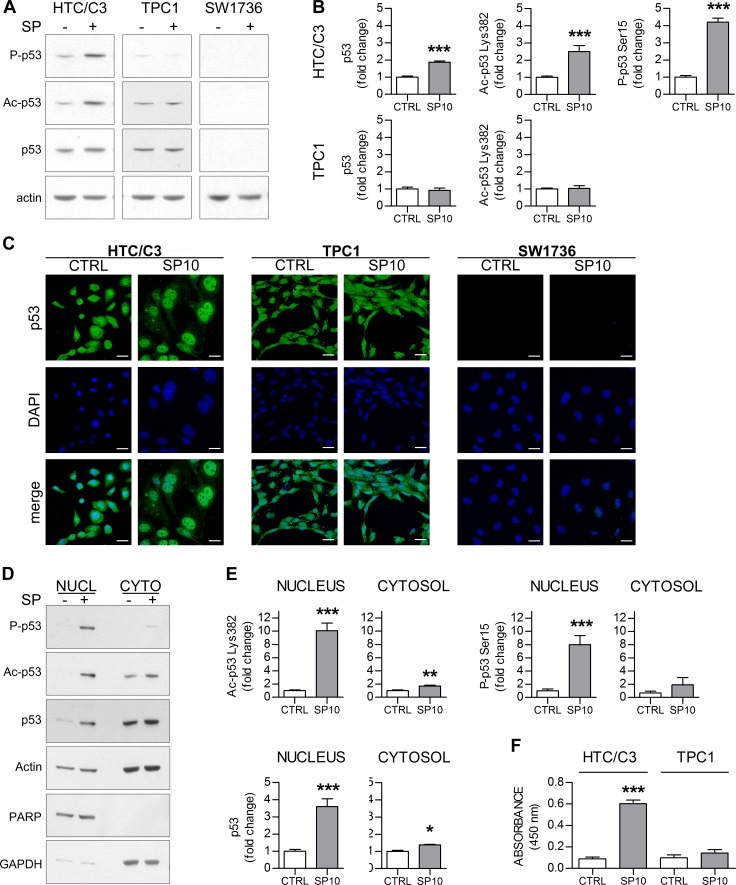
Figure 2. SP induces p53 nuclear translocation and activation in HTC/C3 cells.
HTC/C3, TPC1 and SW1736 cells were incubated with 10 μM SP (SP10) or equivalent amount of DMSO (CTRL) for 96 hours; p53 nuclear translocation, its activating post-translational modifications and DNA binding capacity was examined. A. Representative images of whole cell lysates western blots showing the levels of Ser 15 phosphorylated (P-p53), Lys 382 acetylated (Ac-p53) and total p53; actin was used as loading control. B. Densitometric analysis of whole cell lysates western blots. C. Confocal microscopy images showing changes in p53 (green staining) subcellular localization following SP treatment. DAPI (blue staining) was used as nuclear marker. Scalebars: 30 μm. D. Representative images of western blots of the nuclear (NUCL) and cytosolic (CYTO) extracts of HTC/C3 cells. The amount of Ser 15 phosphorylated (P-p53), Lys 382 acetylated (Ac-p53) and total p53 was examined. Actin was used as loading control, PARP was used as nuclear marker and GAPDH was used as cytoplasmic marker. E. Densitometric analysis of the western blots of the HTC/C3 subcellular fractions. F. SP-induced changes in the DNA binding capacity of p53 in the two model cell lines expressing p53 protein.. *p < 0.05, **p < 0.01, ***p < 0.001 vs. control.

