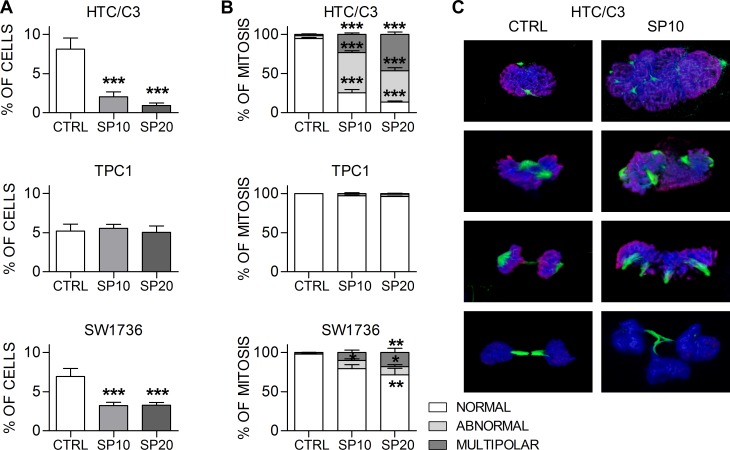
Figure 4. SP induces mitotic alterations in sensible cells.
Cells were incubated with 10 μM (SP10) and 20 μM (SP20) SP or equal amount of DMSO (CTRL) for 72 hours and mitosis were analyzed with confocal microscopy. A. percentages of mitotic cells per microscopy field. B. percentages of normal, abnormal and multipolar mitosis. C. Representative 3D reconstructions from confocal images of normal mitotic figures in DMSO treated (CTRL) and abnormal mitotic figures in SP treated HTC/C3 cells. Staining shows Ser 10 Phospho-Histone H3 (red) and mitotic spindle (tubulin, green); DNA was labeled with DAPI (blue). *p < 0.05, **p < 0.01, ***p < 0.001 vs. control.

