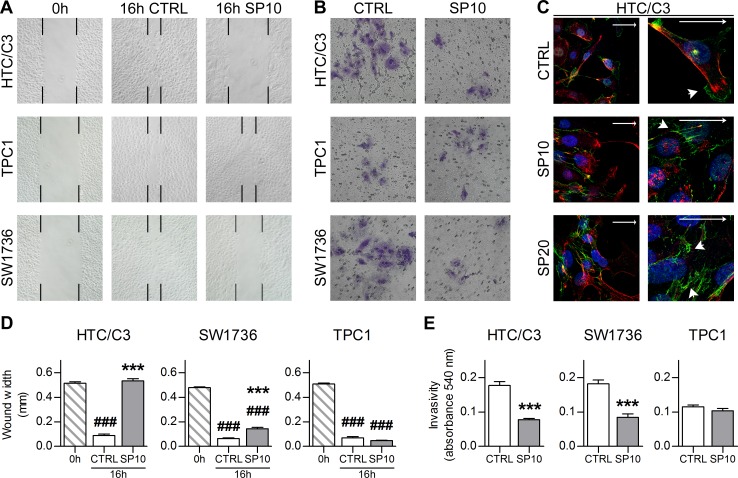
Figure 7. SP inhibits cellular migration and invasiveness.
A. Representative images of wound-healing assays with 10 μM SP (SP10) or equivalent amount of DMSO (CTRL) treatment. Black marks indicate wound edges at 0 and 16 hours post wound. B. Representative images of crystal violet stained cells from invasion assays after 10 μM SP (SP10) or equivalent amount of DMSO (CTRL) treatment. C. Effects of 10 μM SP (SP10), 20 μM SP (SP20) or equivalent amount of DMSO (CTRL) treatment on β-catenin localization in migrating HTC/C3 cells and its details at higher magnification. Scalebars represent 30 μm throughout the figure and indicate free edge direction. Arrowheads indicate β-catenin staining at cell membrane leading edge (CTRL) and intercellular junction (SP treated). Staining shows β-catenin (green), nucleus (DAPI, blue) and cell membrane (WGA, red). D. Quantification of wound width in wound-healing assays. E. Quantification of invasivity by lower-chamber cells solubilization and absorbance reading. ###p < 0.001 vs. 0 hours post wound, ***p < 0.001 vs. CTRL.

