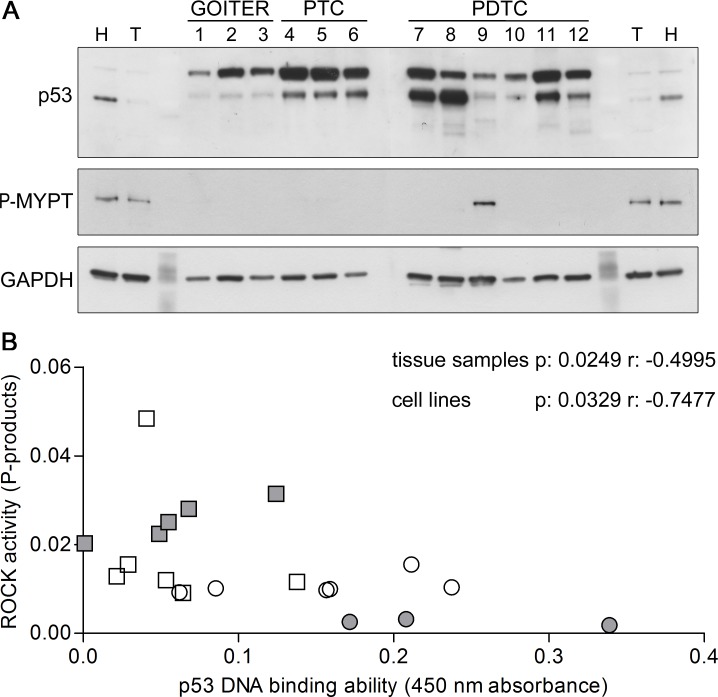
Figure 8. p53 and ROCK activity in thyroid tissue samples.
A. Representative images of western blots of thyroid tissue samples derived from multinodular goiters (GOITER), papillary thyroid cancers (PTC) and poorly differentiated thyroid cancers (PDTC) showing the relative amount of p53 and Thr 696 phosphorylated MYPT1 (P-MYPT); GAPDH was used as loading control. An aspecific band of approximately 70 kDa was detected by p53 antibody. B. p53 DNA binding ability plotted versus ROCK activity graph of thyroid tissue samples (white symbols) and cell lines (grey symbols) showing significant negative correlation. Differentiated samples are reported as circles while poorly differentiated and anaplastic samples are reported as squares.

