
Figure 2. Alteration of primary tumor growth following MEK and mTOR inhibition in vivo.
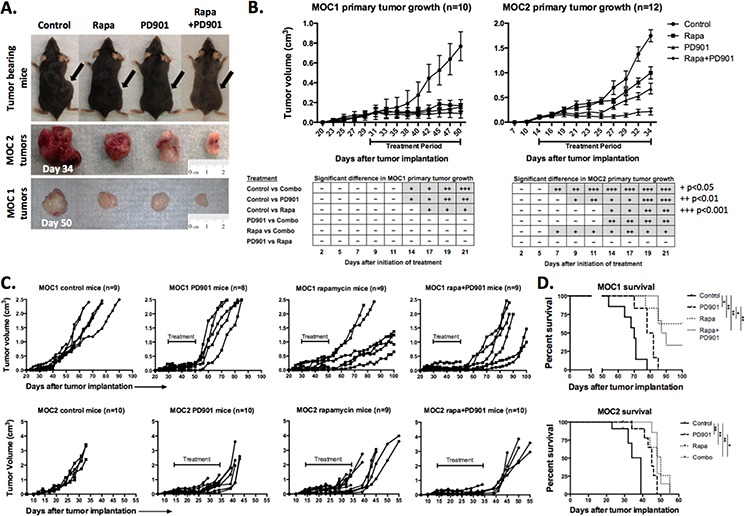
A. Representative photographs of MOC1 (day 50) and MOC2 (day 34) tumor-bearing mice and corresponding excised tumors. B. Primary tumor growth curves for MOC1 and MOC2 tumors with indicated 21-day treatment period. MOC cells were transplanted and allowed to form tumors with a volume of 0.1 cm3 before initiation of treatment. Table reflects number of days after initiation of therapy needed to reach significant differences between growth curves, +p < 0.05, ++p < 0.01, +++p < 0.001 (parametric or non-parametric t-test for each time point). C. extended individual growth curves of tumor bearing mice plotting primary tumor growth after the completion of the treatment. Treatment period indicated on each plot. Extended growth data was derived from mice not euthanized for tissue at the end of the treatment period. All MOC2 tumor-bearing mice reached end-point criteria, whereas several rapamycin and combo treated MOC1 mice were alive at the end of the experiment (100 days) and were euthanized before end-point criteria were reached. D. survival data for MOC1 and MOC2 tumor-bearing mice (*p < 0.05, **p < 0.01, ***p < 0.001, Log-Rank/Mantel-Cox test).