
Figure 4. Variable alteration of in vivo tumor vascularity and angiogenic cytokine expression following MEK and mTOR inhibition.
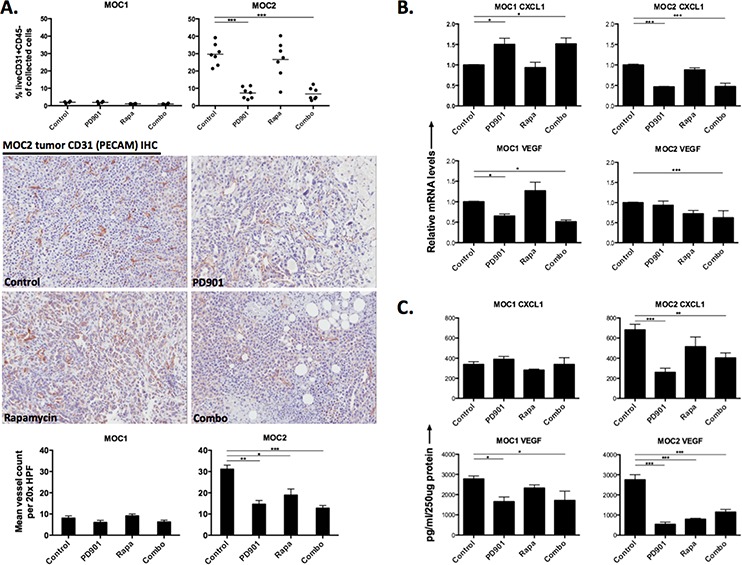
A. flow cytometric analysis of CD45-CD31+ cells in MOC1 and MOC2 tumors along with representative 20x photomicrographs of MOC1 and MOC2 tumor CD31 IHC to visually assess CD31+ blood vessels. Mean vessel counts were calculated from eight 20x HPFs per tumor and treatment condition. Isotype control staining confirmed specific CD31 antibody staining. Expression of CD31 on MOC1 and MOC2 tumor cells was ruled out at the protein level in vitro with flow cytometry (data not shown). B. quantification of angiogenic cytokine RNA from MOC1 and MOC2 tumor lysates via RTPCR. C. quantification of angiogenic cytokine protein from MOC1 and MOC2 tumor lysates via ELISA. For RTPCR and ELISA, three separate tumors from each tumor and each treatment condition were assessed in technical triplicate. *p < 0.05, **p < 0.01, ***p < 0.001 for all experiments, analysis via one-way ANOVA with reference to untreated (control) tumors.