
Figure 5. MEK and mTOR inhibition variably alter myeloid cell tumor infiltration and phenotype.
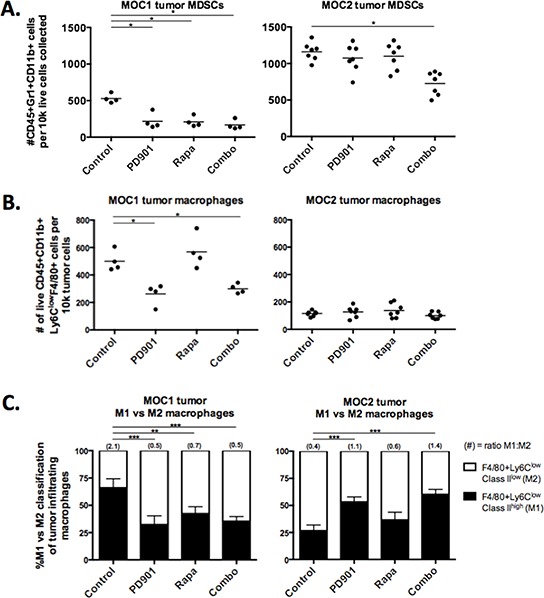
Flow cytometric analysis of tumor infiltrating myeloid cells in MOC1 and MOC2 tumors. Dead cells excluded via 7AAD staining in all experiments. Each data point represents a separate tumor and reported values are per 1 × 10⁵ total collected cells. A. infiltration of CD45+Gr1+CD11b+ MDSCs in rapamycin and PD901 treated tumors. B. infiltration of CD45+CD11b+Ly6ClowF4/80+ macrophages in rapamycin and PD901 treated tumors. C. CD45+CD11b+Ly6ClowF4/80+ macrophages were phenotyped by cell surface MHC class II expression (and CD206 surface expression, see Suppl Fig 4B). We classified M1s as MHC Class II high and M2s as MHC Class II low. Changes in the M1/M2 ratio following treatment with rapamycin and PD901 are shown. Tissues used for analysis are from one in vivo experiment in MOC1 and two independent experiments in MOC2. *p < 0.05, **p < 0.01, ***p < 0.001 for all experiments, analysis via one-way ANOVA with reference to untreated (control) tumors.