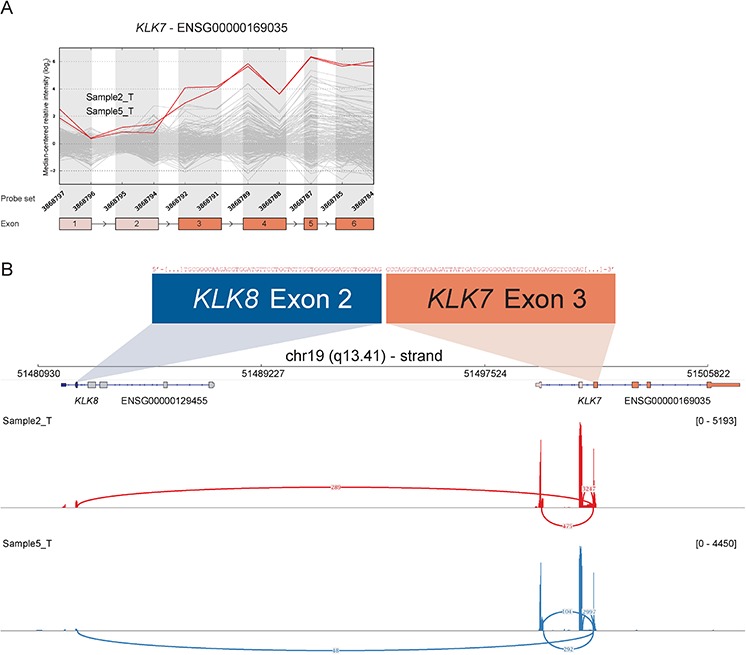
Figure 5. Read-through from upstream KLK8 to KLK7 in samples with deviating 3′ expression of KLK7.

A. The exon expression profile of KLK7 shows that several samples have increased expression of probe sets targeting exon 3 to 6. The top two samples (2_T & 5_T) were selected for RACE-seq to identify underlying transcript structural changes. B. A sashimi plot from IGV shows the alignment of sequencing reads from the two nominated samples for KLK7. The height of the bars represents the number of aligned reads, while arcs represent junctions connected to exon 3 of KLK7 and the coverage of these junctions, as determined by Tophat2 alignment and the sashimi plot package, are shown as numbers on the arcs.
