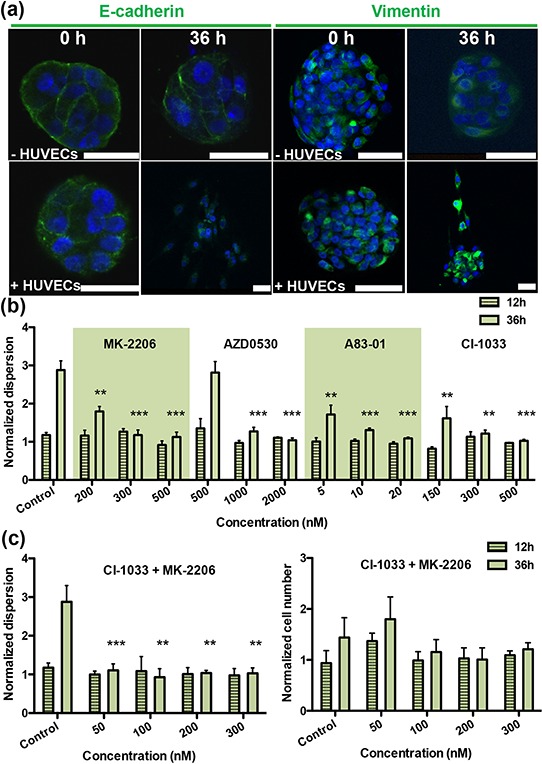
Figure 2. Screening therapeutic drugs on A549 aggregates over 36 h.

a. Staining of EMT markers E-cadherin and vimentin in A549 aggregates at 0 h and 36 h. Green fluorescence is used for both E-cadherin (left panels) and for vimentin (right panels); blue fluorescence is DAPI-stained nuclei. b. Normalized dispersion measured for three concentrations with four drugs at 12 h and 36 h (MK-2206: Akt inhibitor; AZD-0530: Src inhibitor; A83–01: TGF-βR inhibitor; CI-1033: EGFR inhibitor), for three different concentrations in the presence of HUVEC. c. Normalized dispersion measured over time (12 h and 36 h) for analysis synergistic effects between CI-1033 and MK-2206, at four different concentrations (left: dispersion; right: cell number).
