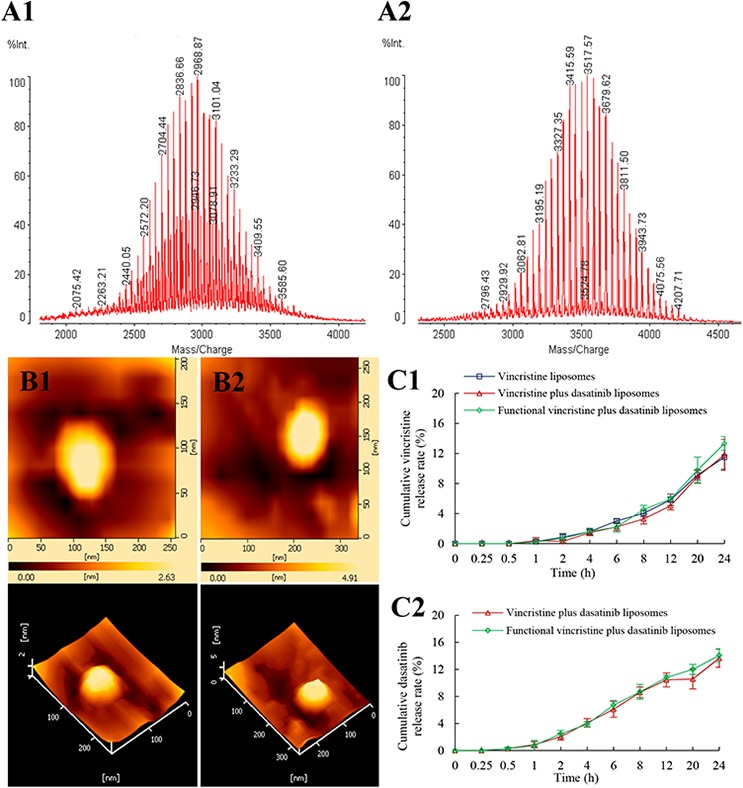
Figure 2. Characterization of targeting molecules and functional vincristine plus dasatinib liposomes.

Notes: MALD-TOF-MS spectra of (A1) DSPE-PEG2000-NHS and (A2) DSPE-PEG2000-c(RGDyK) targeting molecule. AFM images of (B1) vincristine liposomes and (B2) functional vincristine plus dasatinib liposomes. Release rates of (C1) vincristine and (C2) dasatinib from the liposomes. Data are presented as the mean ± SD (n = 3).
