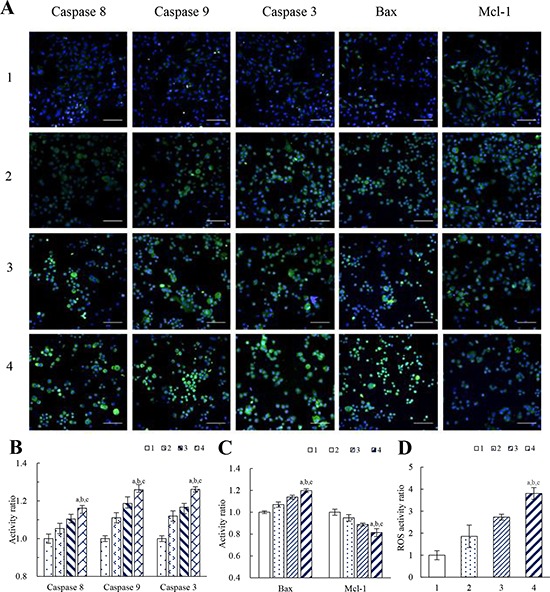
Figure 5. Effects on apoptotic enzymes, apoptotic proteins and ROS level of MDA-MB-231 cells after treatment with functional vincristine plus dasatinib liposomes.

Notes: A. Fluorescent images of the expressed apoptotic enzymes and apoptotic proteins (scale bar = 100 μm). B. Activity ratios of caspase 8, caspase 9 and caspase 3. C. Activity ratios of Bax and Mcl-1. Data are presented as the mean ± SD (n = 6). D. ROS activity ratio. Data are presented as the mean ± SD (n = 3). 1, blank control; 2, vincristine liposomes; 3, vincristine plus dasatinib liposomes; 4, functional vincristine plus dasatinib liposomes. p < 0.05, a, vs. 1; b, vs. 2; c, vs. 3.
