
Figure 2. Functional and network analyses of 22g-TAG signature.
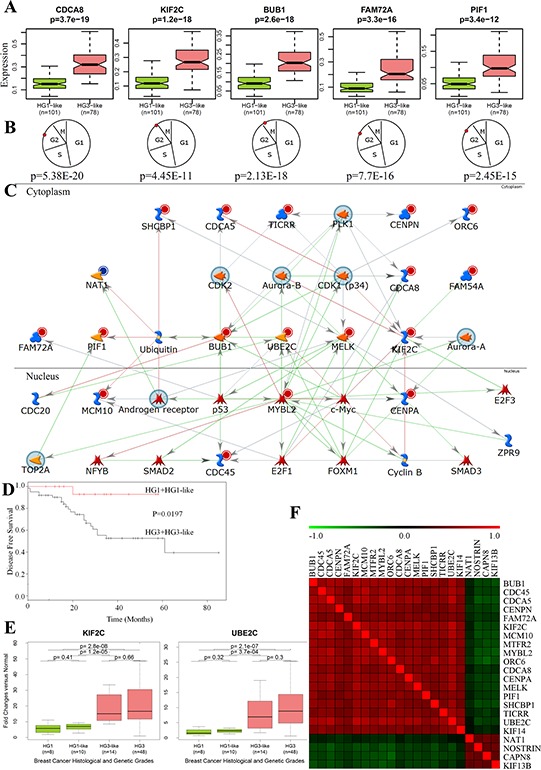
A. The differences in gene expression profiles between HG1-like and HG3-like samples for 5 genes from 22g-TAG signature. B. The peak expression of the 5 genes at the G2/M phase of the cell cycle. P is the p-value, which assesses the periodicity of a gene during the cell cycle according to the Cyclebase database. C. Network analysis of 22g-TAG signature genes using MetaCore network analysis tool. D. Kaplan-Meier curves of LGG and HGG patients' disease-free survival classified based on qPCR data of 22g-TAG genes E. Examples of the difference in qPCR-based expression for 2 genes of 22g-TAG for all histological and genetic grades of IDC patients. F. Heatmap of Kendall tau correlation coefficients between 22g-TAG genes using their qPCR-based relative expression profiles.