
Figure 3. Major genomic and transcriptomic variations between subclasses of IDC determined by 22g-TAG classifier.
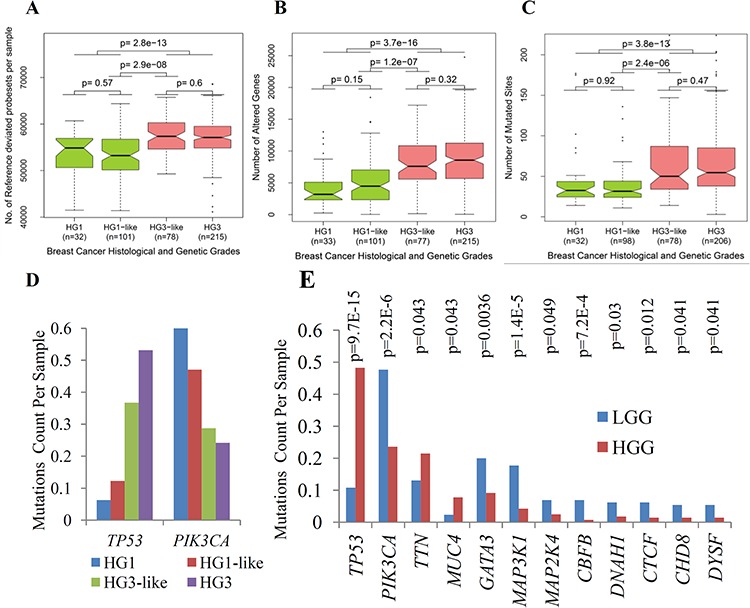
A. Box plots of the number of reference deviated genes (RDG) per sample for histological and genetic grades of IDC associated with 22g-TAG classifier. B. Box plots of the numbers of altered genes (AG) per sample for histological and genetic grades of IDC associated with 22g-TAG classifier. C. Box plots of mutations count per sample for histological and genetic grades of IDC associated with 22g-TAG classifier. The differences in the numbers of RDG, altered genes or mutations counts between different combinations of genetic grades were assessed statistically using two-tailed Wilcoxon test. D. Bar plots of mutations counts per sample for different genetic grades for TP53 and PIK3CA. E. Bar plots of mutations counts per sample in LGG and HGG tumors for 12 genes that are correlated significantly with LGG and HGG classification. P is p-value of Fisher exact test.