
Figure 4. Copy number variation visualization of few chromosomes in which the differentially altered genes between LGG and HGG are enriched.
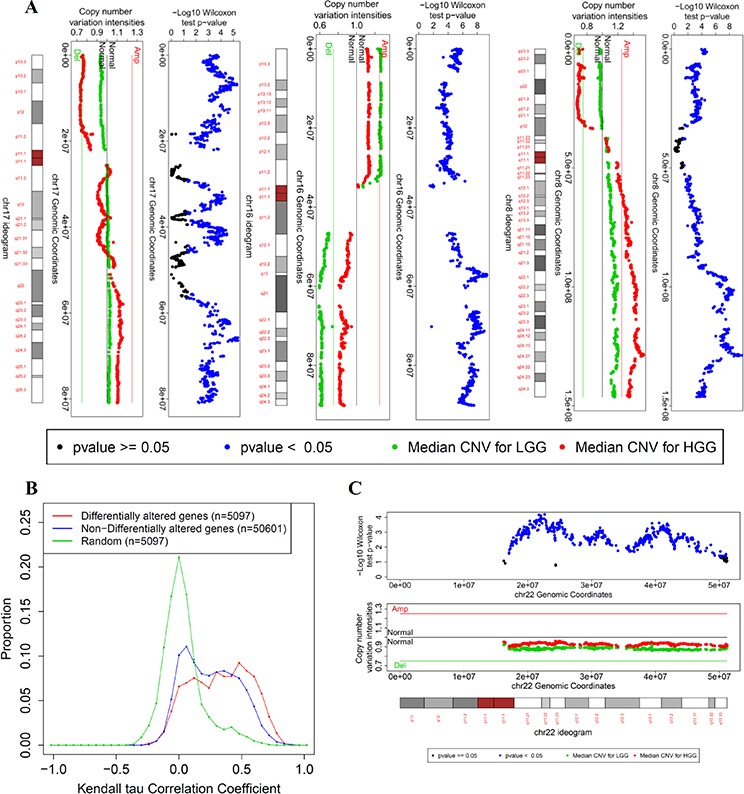
A. Copy number variation for chromosomes 8, 16, and 17. For each chromosome, three bars are shown: - The upper bar is a plot of the negative log p-value of the Wilcoxon test per gene against its transcription start site. The Wilcoxon test assesses the difference in CNV profile between LGG and HGG tumors for each gene. -The middle bar is the median values of the CNV signal intensities of LGG (green) and HGG (red) tumors per gene against its transcription start site. - The lower bar is the ideogram of the corresponding chromosome (centromere in red). B. The distributions of Kendall's tau correlation coefficients between CNV and corresponding gene expression of differentially altered genes between LGG and HGG tumors (red), non-differentially altered genes (remaining genes in the genome, blue), and a random match between the CNV profile and gene expression profile as a control distribution (n represents number of different combinations of matching the CNV profiles of genes with their expression profiles of multiple probesets). C. copy number variation visualization of chromosome 22.