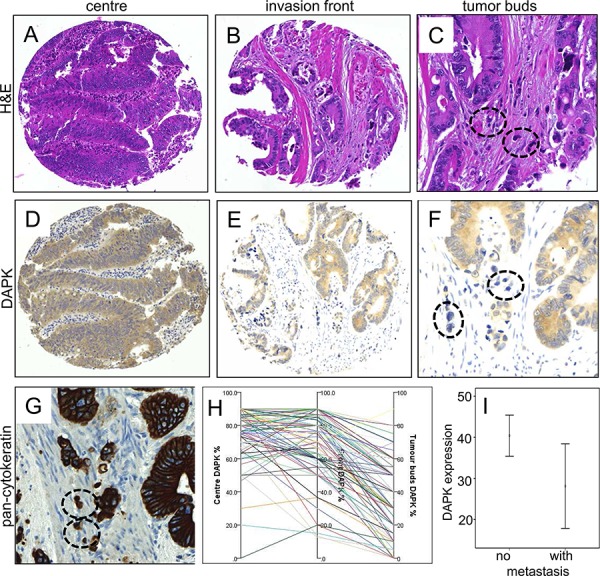
Figure 1. Immunohistochemical staining of DAPK protein expression in tumors of colorectal cancer patients.

Examples of tumor center A, D. and invasion front B, E. in comparison with H&E staining (A, B) and DAPK immunohistochemistry (D, E). Overall there is only a faint reduction of staining intensity from tumor center to the invasion front. The detailed analyzes of tumor buds in H&E C., a standard pan-cytokeratin staining (AE1-3, routine protocol, G. and DAPK immunohistochemistry F. revealed an almost vanishing DAPK expression in these small tumor cell clusters (encircled). A summary of the DAPK gradients across these tumor areas in the same samples is plotted in H. Of note, the tumor bud pictures highlight the interaction with dense inflammatory infiltrates (C, F, G). I. Statistical analysis of DAPK expression in tumor buds of patients with or without metastasis (p = 0.034).
