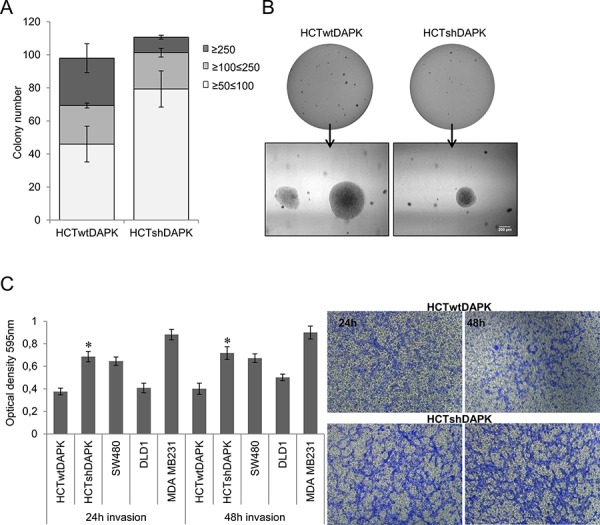
Figure 5. Colony formation and invasion assay of HCTshDAPK and HCTwtDAPK cells.

A. Colonies were fixed and stained with crystal violet (0.5%), photographed and counted visually B. Bar, 200 μm. Values are based on different size of colony diameter from four different fields. Data shown represent means ± SD (n = 2). C. Transwell invasion assay was performed using the Corning Costar Matrigel Matrix coated migration chamber (8 μm pore size). Cells were seeded in the upper chamber in medium with 5% fetal bovine serum, and left for the invasion through the matrigel membrane for 24 h and 48 h into the lower chamber well with 10% fetal bovine serum medium. The upper surface of the filter was swabbed with cotton to remove non-invading cells. Invading cells were stained with 0.5%(w/v) crystal violet, quantified by solubilising bound crystal violet in 1%(w/v) sodium dodecyl sulfate (SDS) for 1 hour at 37°C. Absorbance was measured at 595 nm; *p < 0.05 compared with control; data represent mean ± SD from two independent experiments with two replicates. The photos of invading cells through the Matrigel membrane stained with crystal violet were taken in separated fields at 100× total magnification.
