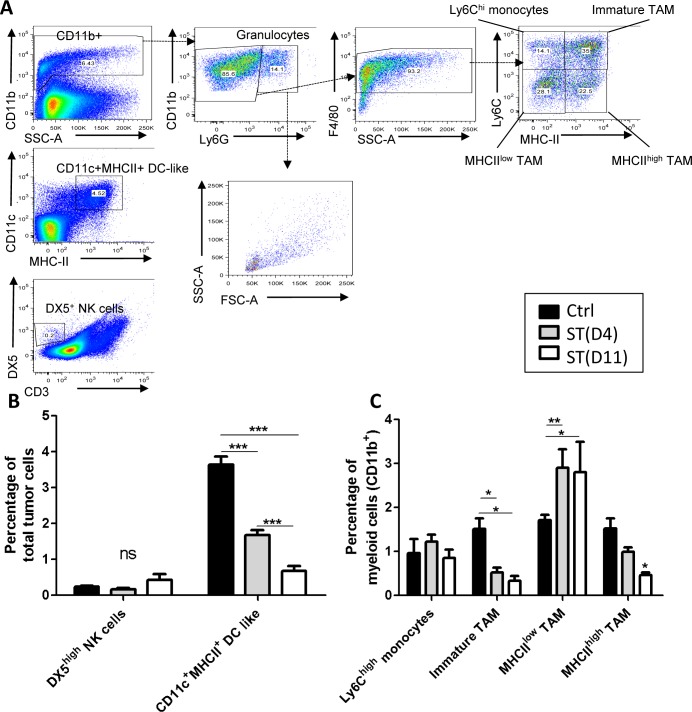
Figure 2. FACS analysis of cells isolated from primary tumors subjected to hypofractionnated RT.
Control SCID mice received only ST. Irradiated SCID mice received 2x5Gy neoRT and tumors were collected 4 (D4) or 11 (D11) days after the end of RT. Single-cell suspension was prepared from primary tumors at the time of surgery and stained for the indicated markers. A. Gating strategy for FACS data analyses. B. Percentage of NK and dendritic Cells of total number of tumor cells. And C. Percentage of Ly6Chigh monocytes, immature TAMs, MHCIIhigh and MHCIIlow TAM of myeloid cells. (n = 5-6) *p < 0.05 ; **p < 0.01; ***p < 0.001.

