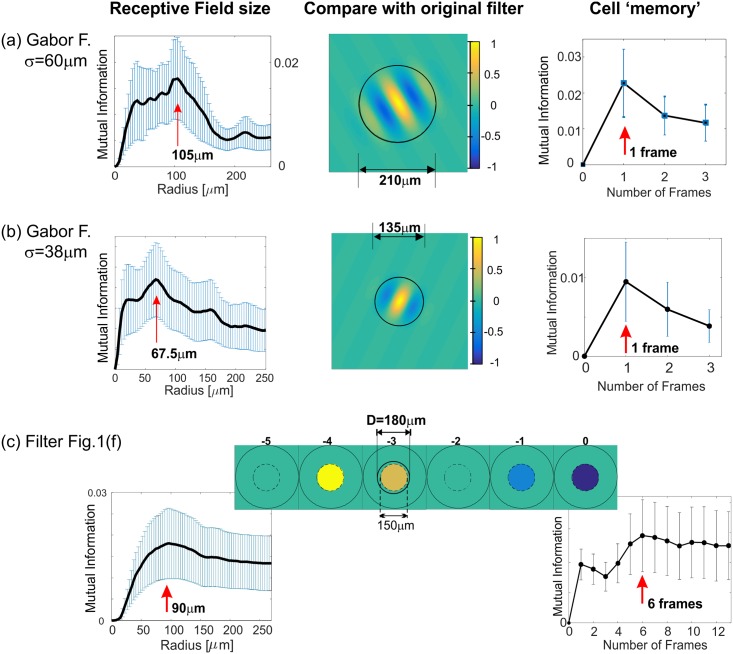
Fig 2. Validation of using MI to estimate the Receptive Field Radius and the Cell Memory.
Left column, MI contained within an increasing radius. The decrease in MI indicates overfitting (see Results). The vertical red arrow indicates the identified radius before the onset of the overfitting artifacts (RMI). Middle column, the original filter with a circle of the radius RMI. Right, MI vs. number of frames that the RFV contains. The relevant receptive field history (or the Cell Memory) was estimated as for the radius and marked with a red arrow. (a) Gabor filter, same as in Fig 1(a), average number of spikes 650. (b) Gabor filter: σx = 38 μm, γ = 1.3, λ = 94 μm, θ = −π/7, 〈spikes〉 = 642. (c) Same filter as in Fig 1(f).

