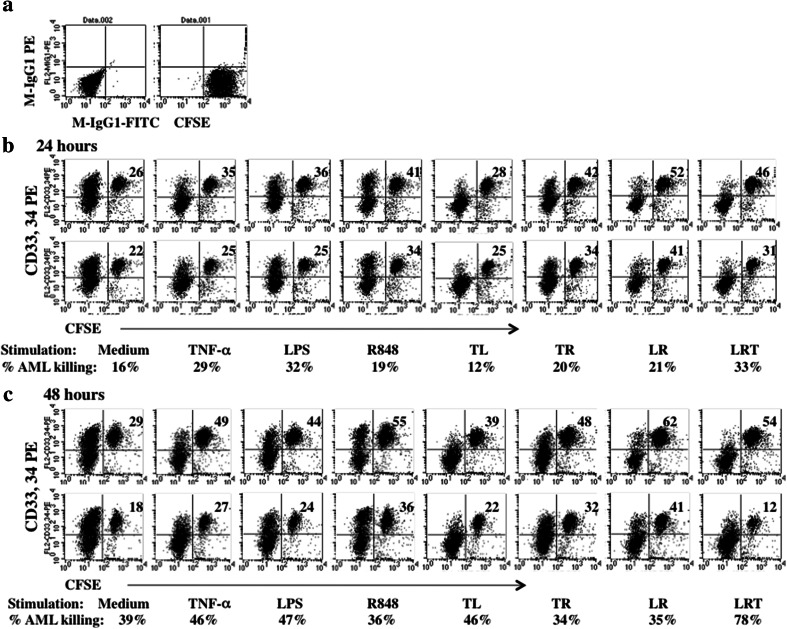
Fig. 3.
CTL activity against AML cells analyzed by FACS (patient #2010-8). CTLs were obtained from AML-MNC culture under different culture conditions. CTL assays were performed as described in “Materials and methods” section. a Isotype antibody and CFSE control. b Percentage of AML elimination by CTL at 24 h of incubation. The top panel shows the percentages of AML cells after 24 h in cultures separate from the AML-CTLs but after mixing with the CTLs just prior to the FACS analysis. The bottom panel shows the percentages of AML cells remaining after 24 h of co-culture with AML-CTLs. c Percent of AML elimination by CTL at 48 h of incubation. The top panel shows the percentages of AML cells after 48 h in cultures separate from the AML-CTLs but after mixing with the CTLs just prior to the FACS analysis. The bottom panel shows the percentages of AML cells remaining after 48 h of co-culture with AML-CTLs. The percentages of AML cell elimination calculated using the equation in “Materials and methods” section are indicated underneath the corresponding FACS plots for each treatment

