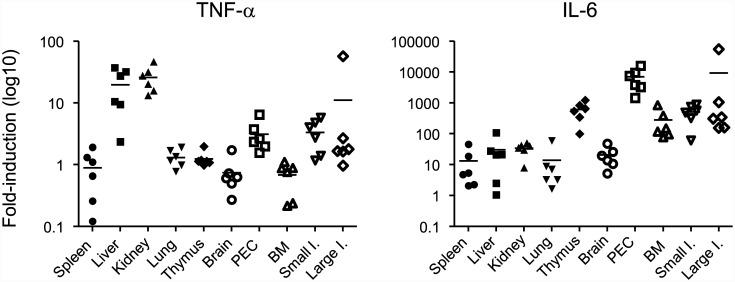
Fig 7. Expression of TNF-α and IL-6 mRNA in organs from IFN-α/β/γR KO mice.
Mice were infected with PBS (n = 3) or with 2 × 10⁶ focus-forming units (FFU) of DV3P12/08 (n = 6) and total RNA was extracted from the spleen, liver, kidneys, lungs, thymus, brain, peritoneal exudate cells (PEC), bone marrow (BM), small intestine, and large intestine at Days 6 p.i., and the levels of TNF-α and IL-6 mRNA were measured by qRT-PCR. The results were analyzed using the comparative Ct method. Dots represent individual mice and bars represent the mean values.

