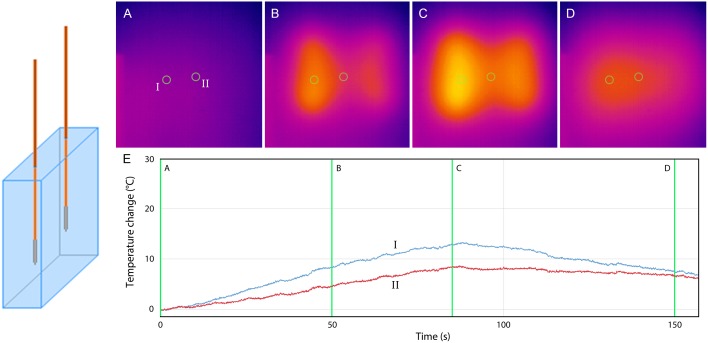
Fig 3. No-stent-IRE.
Thermal camera images during 90 pulses (A-D). (E) Graph showing the temperature increase at the surface of the gel 5 mm from (I) the active tip of the electrode and (II) in between the electrodes. (A) pre-IRE (B) after 50 IRE pulses (C) after 90 IRE pulses (D) 75 seconds after last IRE pulse.

