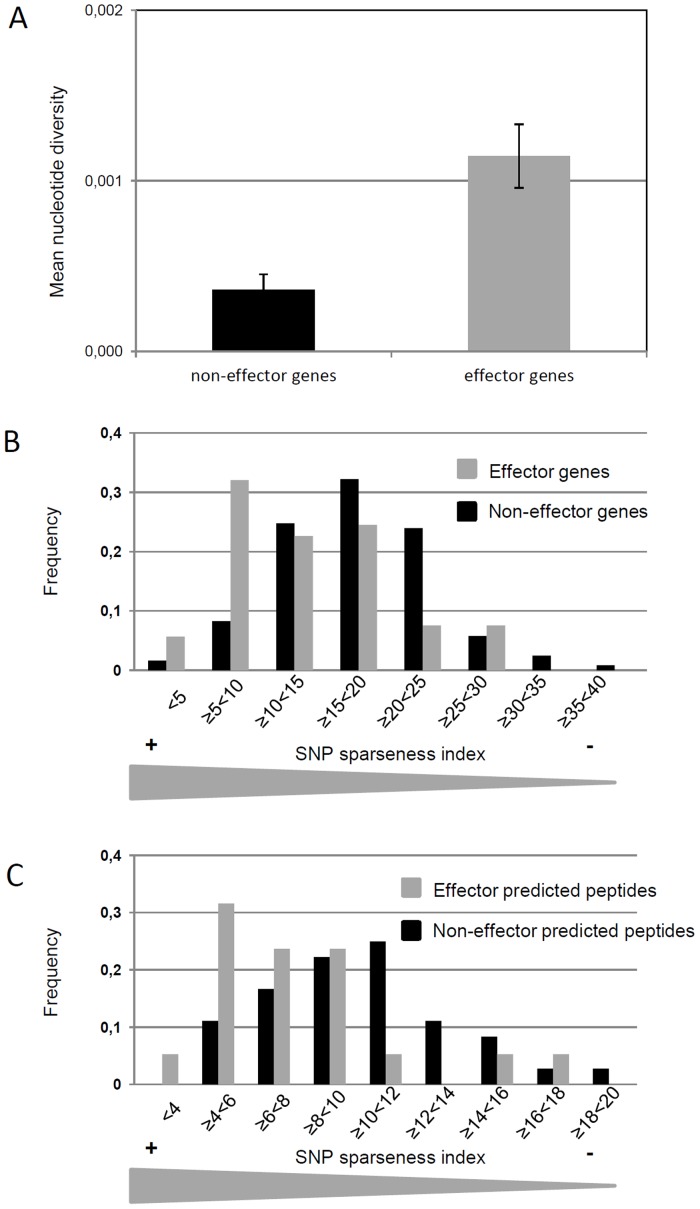
Fig 2. Polymorphism analysis of Pl. halstedii effector and non-effector genes.
(A) Mean nucleotide diversity (π) calculated on non-effector genes (black bar) and effector genes (grey bar). Π values were calculated on DnaSP v5 software. Error bars represent two SEM. (B, C) Comparisons of polymorphism distributions (represented by SNP sparseness, i.e. minimum average distance between two polymorphisms) in Pl. halstedii effector (grey) and non-effector genes (black). (B) Frequency of genes in each class of index. (C) Frequency of predicted peptides in each class of SNP sparseness, among genes with nucleotide polymorphism.

