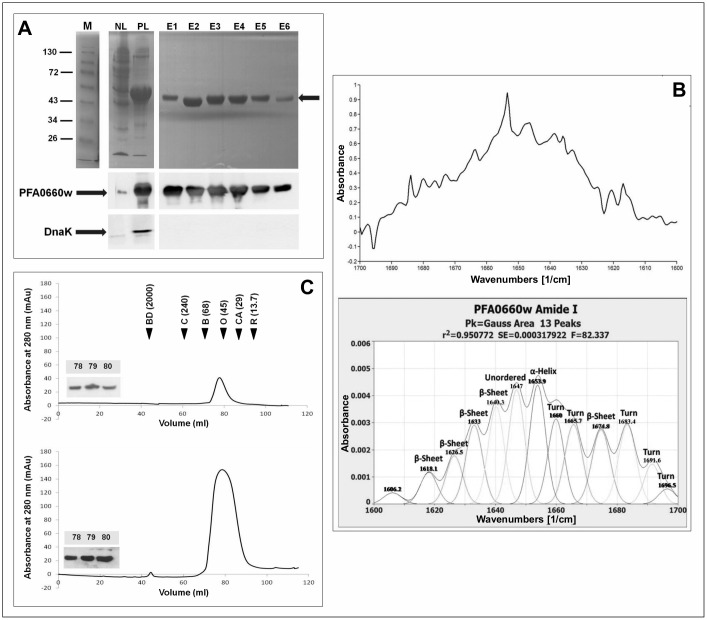
Fig 1. PFA0660w exists as a monomer in solution.
(A): SDS-PAGE (upper panel) and western analysis (lower panel) of PFA0660w purification from E. coli. NL, whole cell lysis supernatant and PL, supernatant obtained from urea-solubilized pellets. E1 to E6, elution fractions following purification from PL. The arrow indicates PFA0660w on the SDS-PAGE gel. M is the protein molecular mass marker in kDa. Lower panels show western analysis with anti-His (1:5000) and anti-DnaK primary antibodies (1:5000) for confirmation of the presence of PFA0660w and lack of DnaK respectively. (B) The spectra of the amide I region (1600–1700 cm-1) of normalized native PFA0660w samples (upper panel) and secondary structure analysis (lower panel). The infrared spectra were deconvoluted and the peaks fitted with Gaussian curves. The Gaussian curves are shown as symmetrical peaks underneath the deconvoluted infrared spectra. The assigned secondary structures are shown at the top of each peak. Relative contents of the secondary structure calculated as the proportion of the peaks areas to the total area under the curve are 38.17% β-sheets, 38.82% turns, 13.03% α-helix, 12.57% unordered and 1.41% un-assigned. (C) Analysis of the FPLC chromatographs of PFA0660w at 0.11 mg/ml for the upper panel and 0.54 mg/ml for the lower panel with an injection volume of 2 ml. The elution volumes for the standards are indicated with black filled arrowheads and were determined by peak integration as follows: 43.79 ml for blue dextran (BD), 62.19 ml for catalase (C), 71.35 ml for BSA (B), 80.30 ml for ovalbumin (O), 87.99 ml for carbonic anhydrase (CA) and 96.25 for RNase A (R). Molecular masses in kDa are given in parenthesis and blue dextran was used to determine the void volume. Western analysis with anti-His antibody (1:5000) of elution volumes 78, 79 and 80 ml are inserted.

