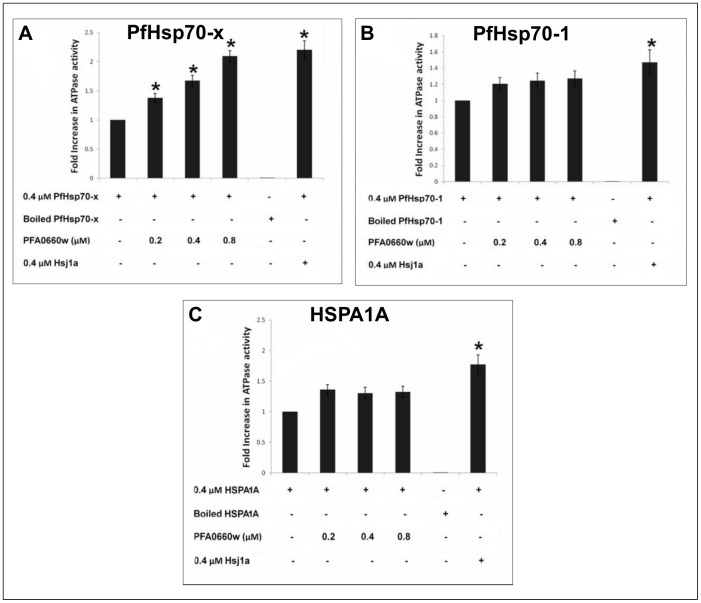
Fig 2. PFA0660w stimulates the ATPase activity of PfHsp70-x.
The bar graphs show the basal and PFA0660w-stimulated ATPase activities of PfHsp70-x (A), PfHsp70-1 (B) and HSPA1A (C) expressed as mean ± SEM. Each set of bar graphs represents the fold increase in the ATPase activity of the Hsp70 alone (0.4 μM) or in combination with sub-molar (0.2 μM), equimolar (0.4 μM) and molar excess (0.8 μM) concentrations of PFA0660w or equimolar (0.4 μM) concentration of Hsj1a. The boiled samples of Hsp70s and native sample of Hsj1a serve as negative and positive controls respectively. All samples were corrected for spontaneous ATP hydrolysis before normalization to obtain fold increase. Error bars are indicated on each bar and * indicates statistical significance at P<0.05 relative to basal ATPase value for respective chaperone using Student T-test. constituents that were either included or omitted from the reaction medium are indicated by (+) or (-) sign, respectively. Shown here are the combined data from three independent experiments performed in triplicate using at least three batches of independently purified proteins for each experiment.

