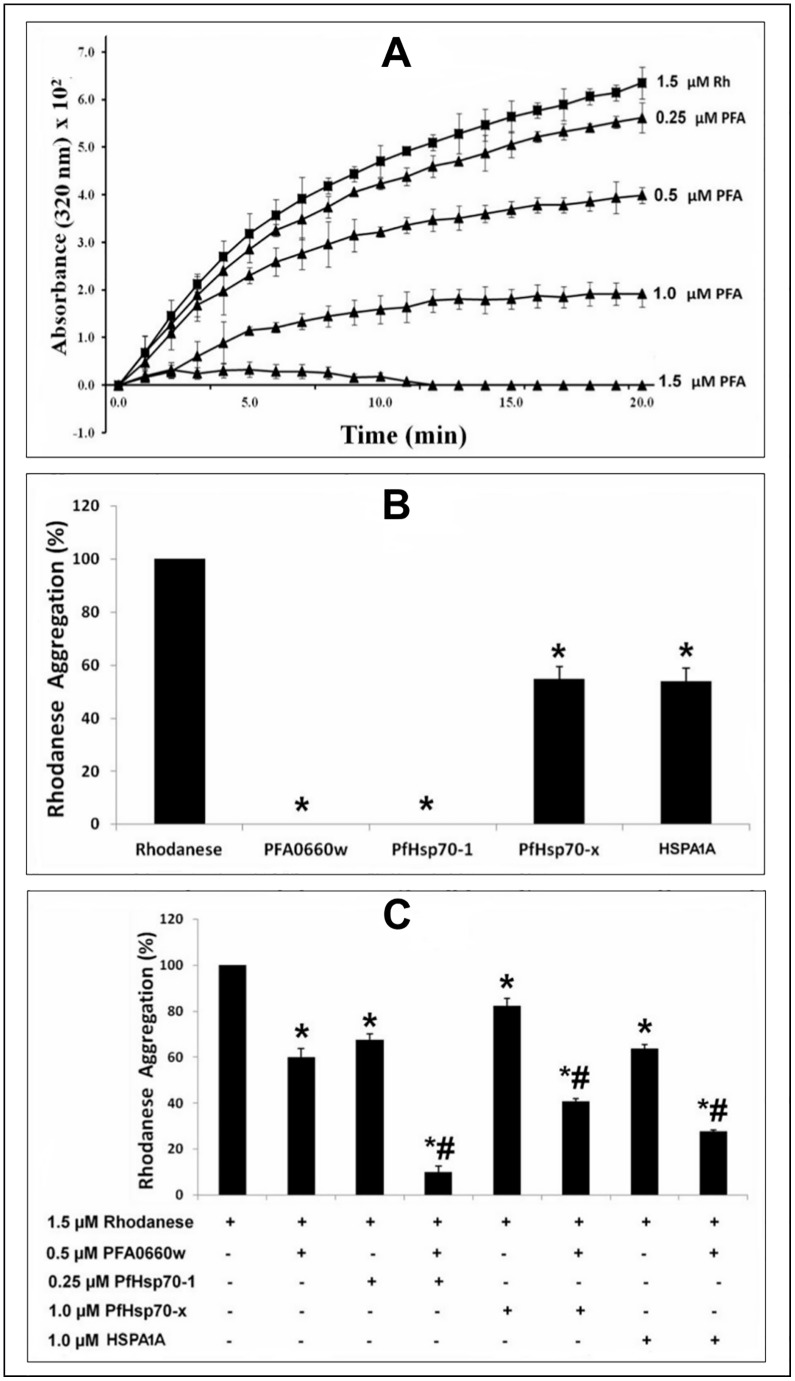
Fig 3. PFA0660w suppresses rhodanese aggregation.
Rhodanese aggregation suppression assays were performed for 20 min at room temperature. (A) The curves of absorbance at 320 nm (x 102) versus time (min) showing aggregation of rhodanese alone (1.5 μM Rh, filled black squares) or in the presence of a range of concentrations (filled triangles) of recombinant PFA0660w (PFA). PFA0660w concentrations are shown at the end of each progress curve. The error bars are indicated for each plotted data. The absorbance values were multiplied by 102 so that the calculated errors can be clearly seen on the graph. Twenty time points were used to plot the progress curves. PFA0660w showed a concentration-dependent suppression of rhodanese aggregation. (B) Bar graphs showing the comparison of the effects of 1.5 μM of PFA0660w, PfHsp70-1, PfHsp70-x and HSPA1A on rhodanese aggregation. Both PFA0660w and PfHsp70-1 produced a complete suppression at 1.5 μM. (C) The effect of PFA0660w (0.5 μM) on rhodanase aggregation suppression activity of PfHsp70-x (1.0 μM), PfHsp70-1 (0.25 μM) and HSPAIA (1.0 μM) respectively. BSA (1.5 μM) was used as a control, and the rhodanese aggregation in the presence of BSA was set as 100% (not shown). Error bars are indicated. An * or # indicates statistical significance at P<0.05 when compared to rhodanese or to both Hsp70s and PFA0660w respectively, using Student T-test. In C, constituents that were either included or omitted from the reaction medium are indicated by (+) or (-) sign, respectively. Shown here are the combined data from three independent experiments performed in triplicate using at least three batches of independently purified proteins for each experiment.

