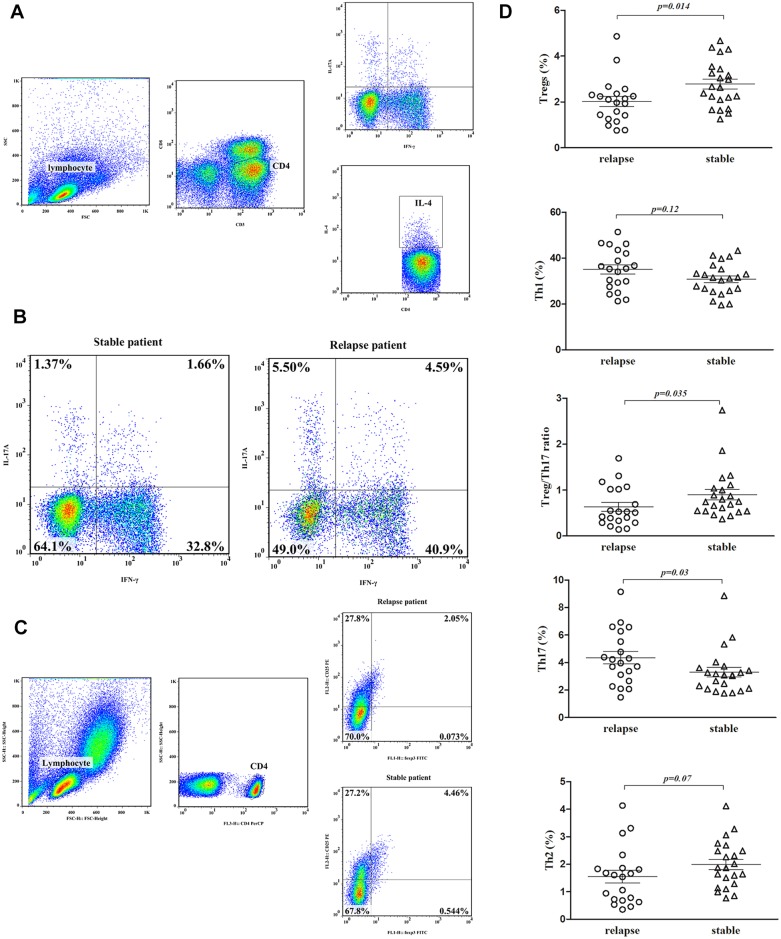
Fig 1. The distributions of Th1, Th2, Th17 and Treg cells in the peripheral blood in relapsed and stable pulmonary sarcoidosis patients after corticosteroid withdrawal.
IFN-γ+CD4+ T cells were defined as Th1 cells, IL-4+CD4+ T cells were defined as Th2 cells, IL-17A+CD4+ T cells were defined as Th17 cells, and Foxp3+CD25+CD4+ T cells were defined as Treg cells. (A) Gating strategy for analysis of IL-17A-, IFN-γ-, and IL-4-expressing CD4+ T cells sorted from lymphocytes by ICCS. The values in the quadrants indicate the percentages of each CD4+ T cell subset. (B) Representative dot plots of Th17 and Th1 cells in the peripheral blood of relapsed and stable patients. (C) Gating strategy for analysis of Foxp3+CD25+ cells in the CD4+ T population sorted from lymphocytes by ICCS. CD25+Foxp3+ cells were gated to correspond to the isotype control. (D) Pooled data demonstrating the percentages of gated Th1, Th2, Th17 and Treg cells from CD4+ T cells in relapsed and stable pulmonary sarcoidosis patients after corticosteroid withdrawal. The percentage of Treg cells and the Treg/Th17 ratio in the stable patients were higher than those in the relapse patients, while the percentage of Th17 cells was lower in the stable patients (p<0.05). There were no differences in the percentage of Th1 cells or Th2 cells between the two groups.

