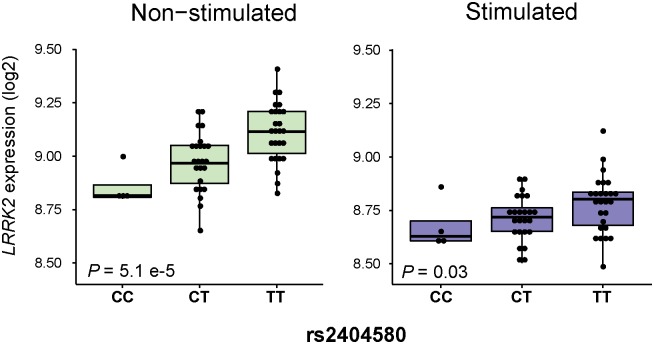
Fig 3. Host versus pathogen control of LRRK2 expression levels.
LRRK2 expression levels for 53 unrelated subjects are indicated on the y-axis and stratified according to rs2404580 genotypes on the x-axis. The left panel represents baseline expression while the right panel indicates gene expression levels following stimulation with M. leprae antigen.

