
Figure 4.
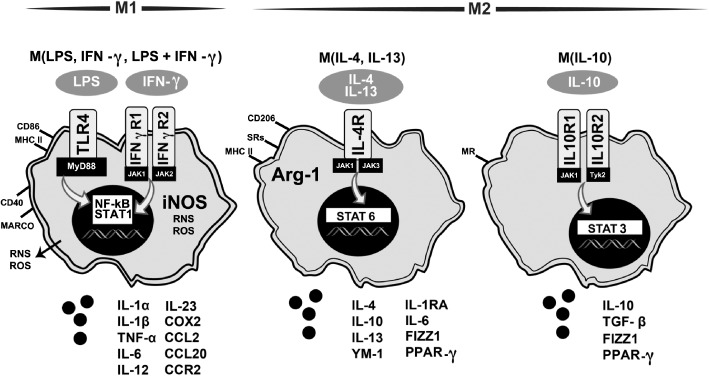
Diagram of activation states of microglia based on inflammatory profile and effector function. Based upon peripheral macrophage nomenclature, M1 and M2 polarization states of microglia have been proposed as a framework to evaluate the heterogeneity of responses (Colton, 2009; Mosser and Edwards, 2008) with recent evaluations suggesting a framework focused on the inducing stimuli (Martinez and Gordon, 2014; Murray et al., 2014). This diagram is based upon these papers and adapted from Martinez and Gordon (2014). Under the classic M1 state, exposure to LPS and/or IFN‐γ stimulates TLR4 or IFN‐γ receptors 1 and 2, respectively, leading to activation of transcription factors NF‐κΒ and STAT1 and increased expression of CD86 and MHC‐II. The increase in iNOS produces a burst of ROS and reactive nitrogen species (RNS) and the release of pro‐inflammatory cytokines, such as IL‐1α, IL‐1β, TNF‐α, IL‐6, IL‐12, IL‐23, the chemokines CCL2 and CCL20, and the receptor CCR2, macrophage receptor with collagenous structure (MARCO) and COX2.
M2 states have been proposed following various stimulatory factors. For example, upon stimulation with IL‐4/IL‐13, binding of the IL‐4 receptor (IL‐4R) initiates activation of STAT6, shifting the cells towards an anti‐inflammatory phenotype with an increase in Arg‐1, expression of CD206 and mannose receptor (MR), and release of anti‐inflammatory factors (IL‐4, IL‐6, IL‐10, IL‐13, IL‐1RA, FIZZ1, and PPARγ. Exposure of the cells to IL‐10 activates STAT6 via stimulation of IL‐10 receptors 1 and 2. This serves to shift the cells to a primary immunosuppressive state with an expression of CD206 and the release of IL‐10, TGF‐β, FIZZ1 and PPARγ.