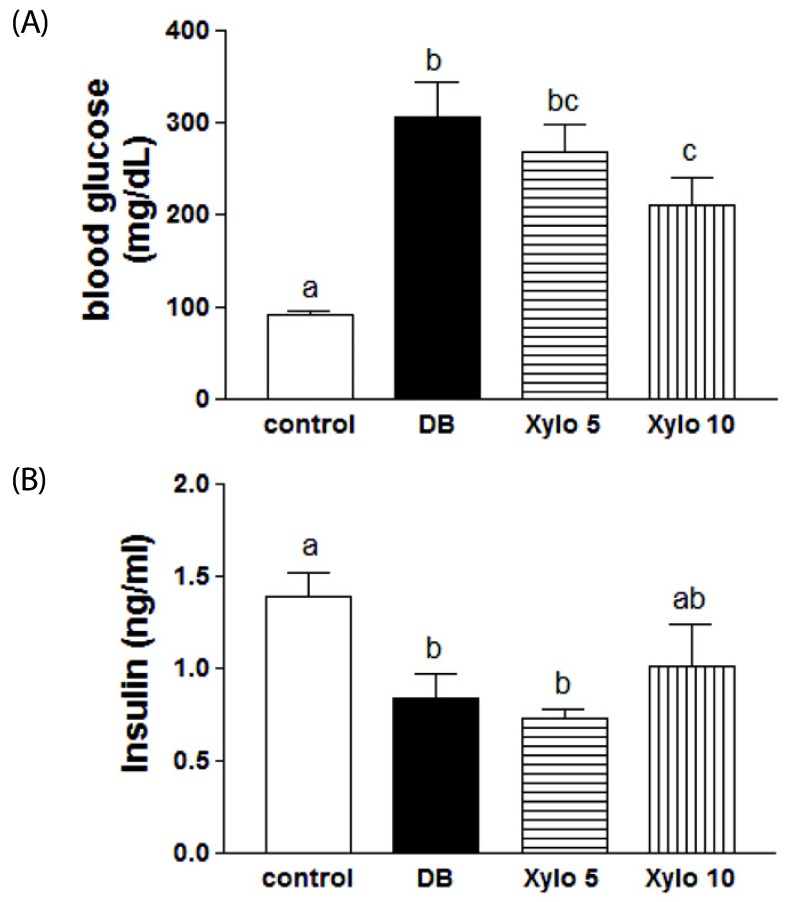
Fig. 2. Effects of D-xylose on the fasting blood glucose and insulin secretion levels.
(A) Fasting blood glucose level, and (B) insulin level are shown for the four experimental rat groups. The values shown are the mean ± SEM. Letters are used to indicate the values that significantly differ from each other (P < 0.05). DB, diabetes control; Xylo 5 or Xylo 10, rat groups that received diets where 5% or 10%, repectively, of the total sucrose content of the diets was replaced with D-xylose

