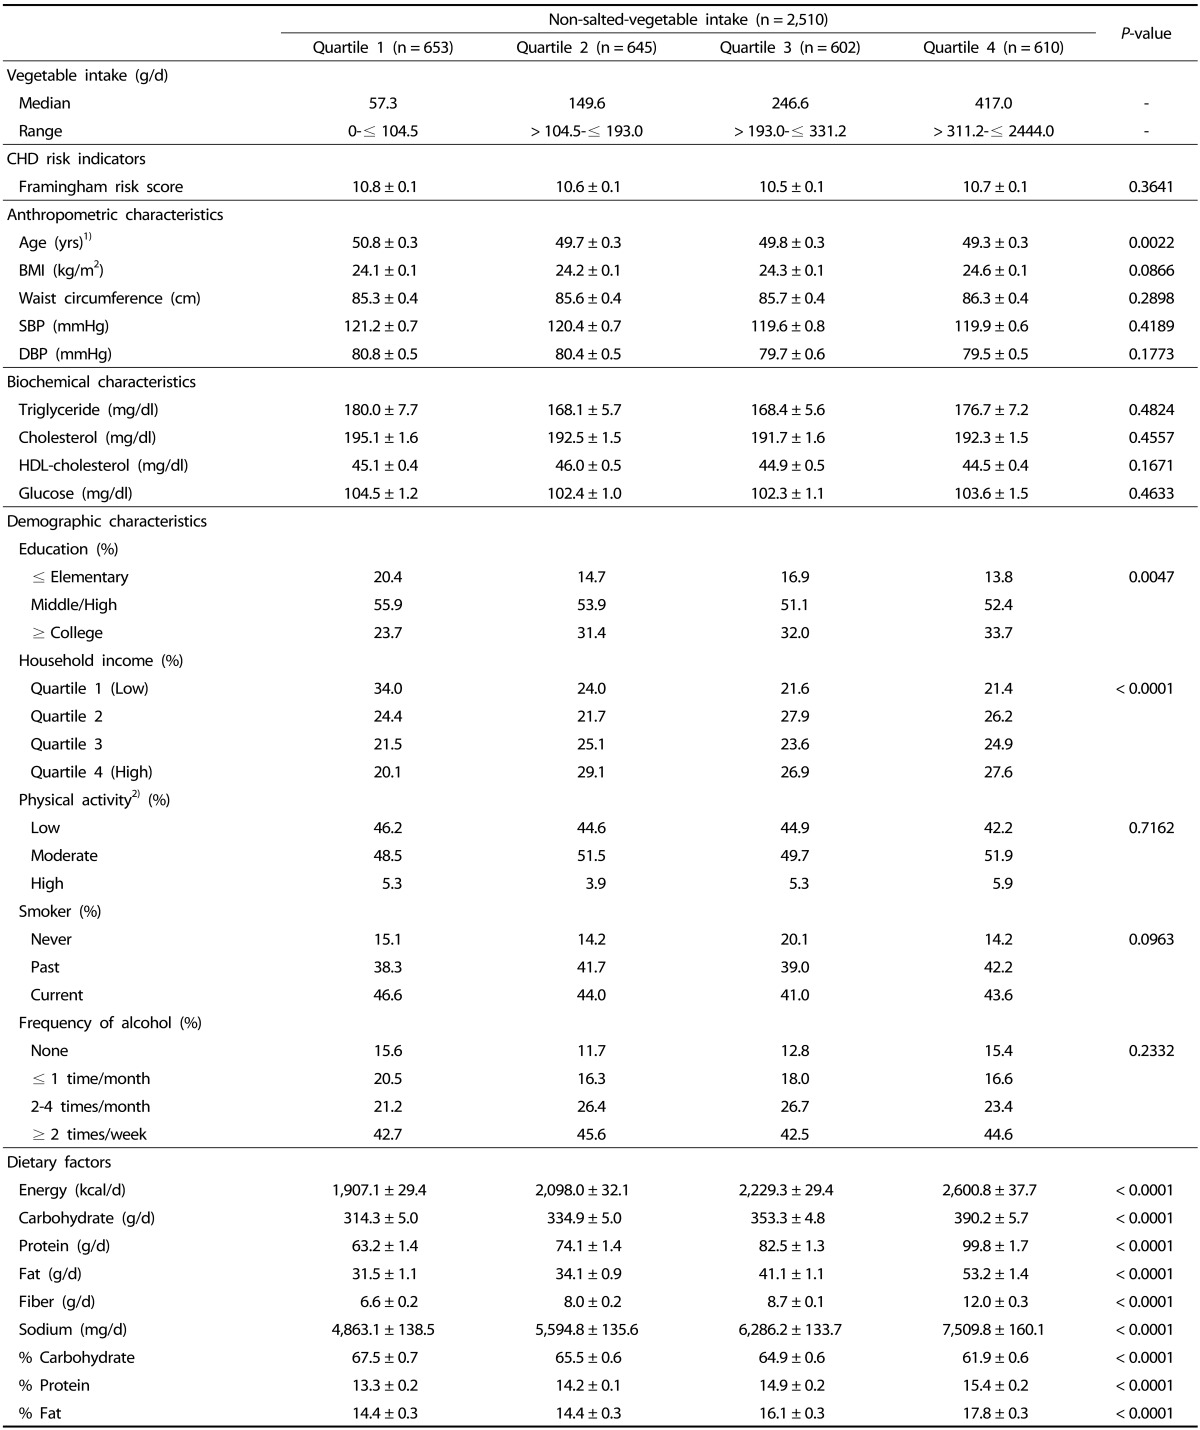
Table 3. Characteristics of participants according to non-salted-vegetable intake.
Data represent age-adjusted mean or prevalence (%) ± SE, except for age.
1) Unadjusted values.
2) Defined as low (< 600 MET-minutes per week), moderate (≥ 600 to < 3,000 MET-minutes per week), and high (≤ 3,000 MET-minutes per week) levels of physical activity

