. 2015 Dec 31;13(4):132–136. doi: 10.5808/GI.2015.13.4.132

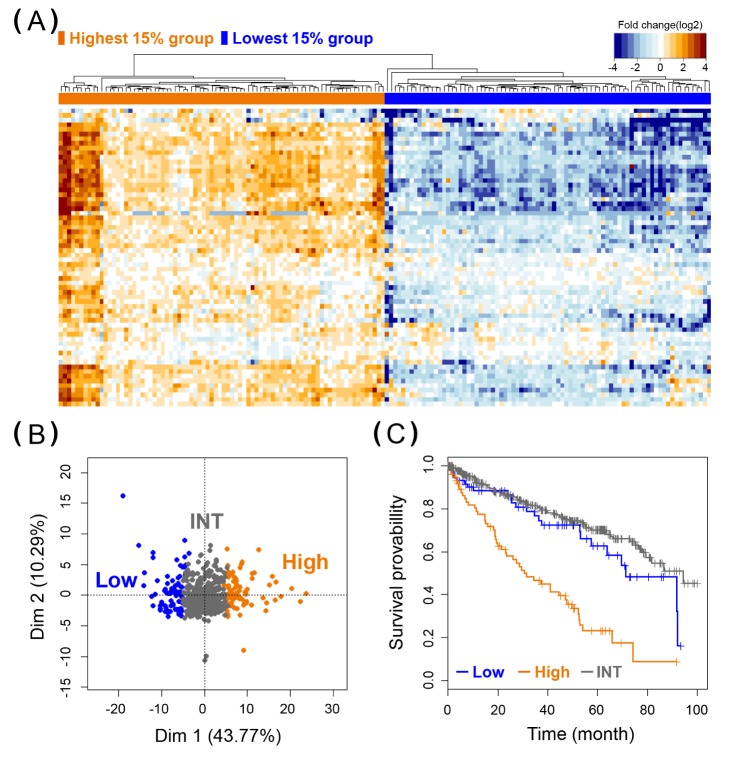
Fig. 1. Heat map, principal component analysis (PCA), and Kaplan Meier (KM) plot analysis of G64 in kidney renal clear cell carcinoma (KIRC). (A) Heat map was plotted using the 160 samples corresponding to the highest 15% and lowest 15% of G64 expression among the total of 531 KIRC samples. (B) A PCA plot of G64 expression was performed using the 531 KIRC samples. Low, the lowest 15% group; INT, intermediate group; High, the highest 15% group. (C) KM analysis of the 531 KIRC samples based on the average G64 expression. Cox regression analysis was used to investigate whether the survival duration of the two different groups was significantly different (p<0.001), as shown in Table 1.

Fig. 1