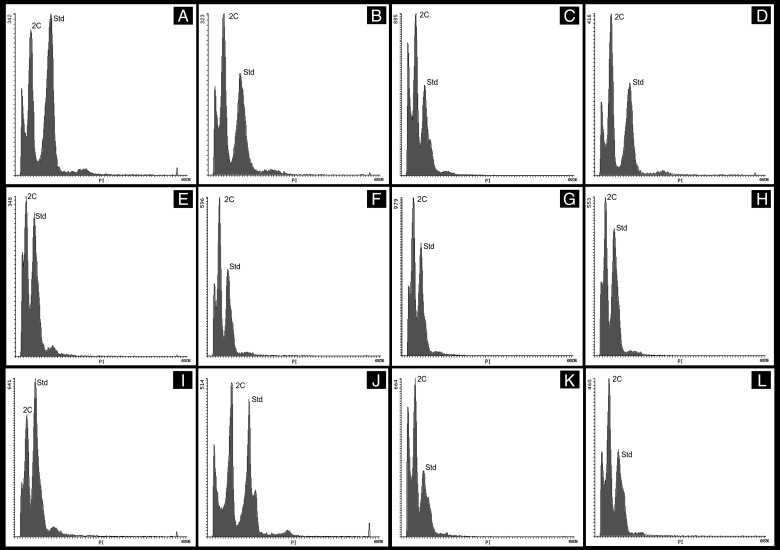
Figure 1.
Fluorescence histograms of individuals of six maize populations. Histograms of (A and B) VAV6557, (C and D) VAV6568, (E and F) VAV6556, (G and H) VAV6569, (I and J) VAV6574 and (K and L) VAV6592. 2C indicates G0/G1 peaks from maize samples and Std indicates G0/G1 peaks from the standard P. sativum.

